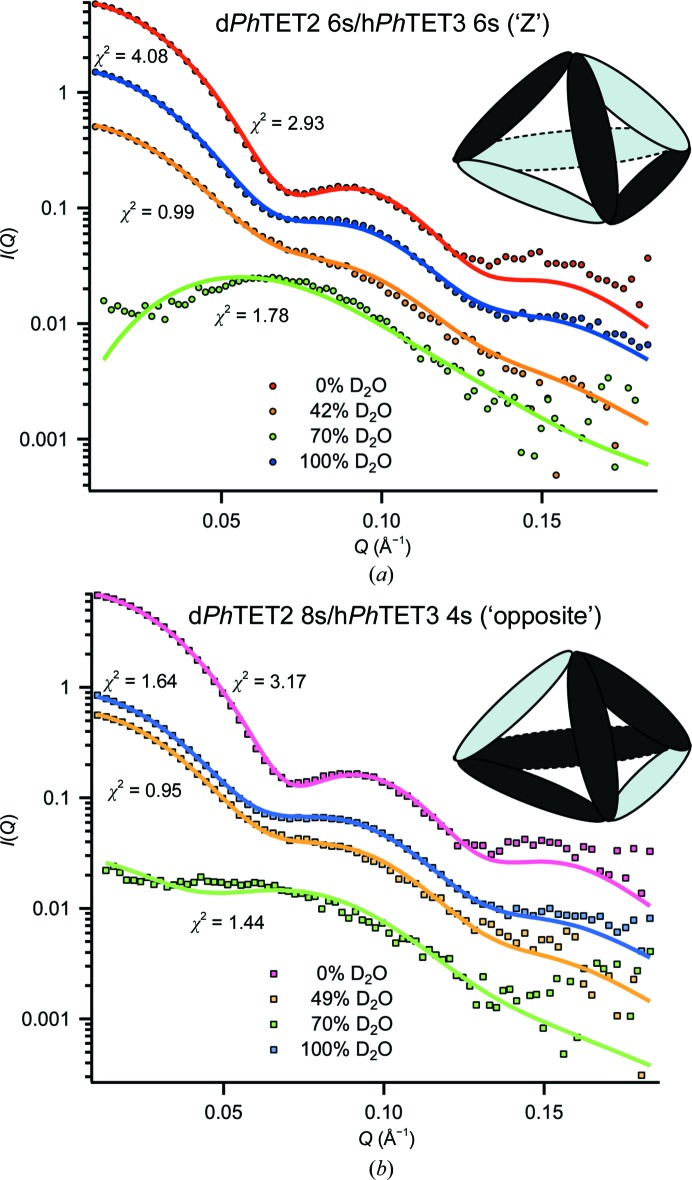
Figure 5.
SANS data and best models for peak 1 and peak 2: the two architectures (‘Z’ and ‘opposite’) that are in best agreement with the SANS data of peak 1 (a) and peak 2 (b), along with their respective fits at four different contrasts. Elongated ellipsoids represent dPhTET2 (dark grey) and hPhTET3 (light grey) homodimers. Intriguingly, each tetrahedral apex brings together catalytic sites of different substrate specificity.

