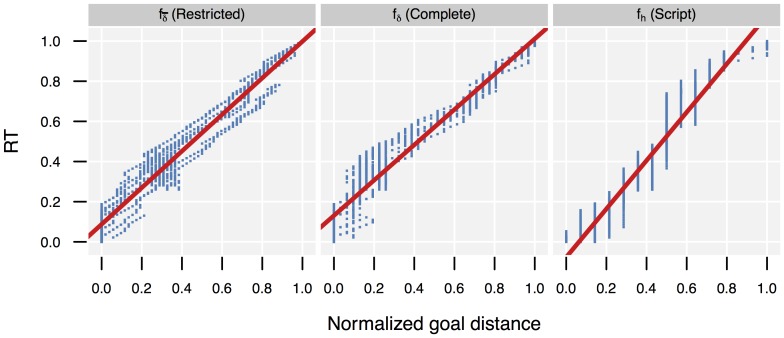
Figure 8. Observed normalized remaining time to goal (RT) versus normalized goal distances.
Data based on  states traversed in observed sequences. These states have been entered at different times by different subjects; due to alternative paths also multiple discoveries by the same subject were possible. In total, 960 different discovery events were recorded (blue points in plot). For each discovery event, we plot normalized goal distance of discovered state (X axis) versus remaining execution time (Y axis). The three plots show the values for different goal distance computation methods/heuristics. The red line is the linear model predicting (RT) from heuristics using
  . Table 6 gives properties of linear models.

