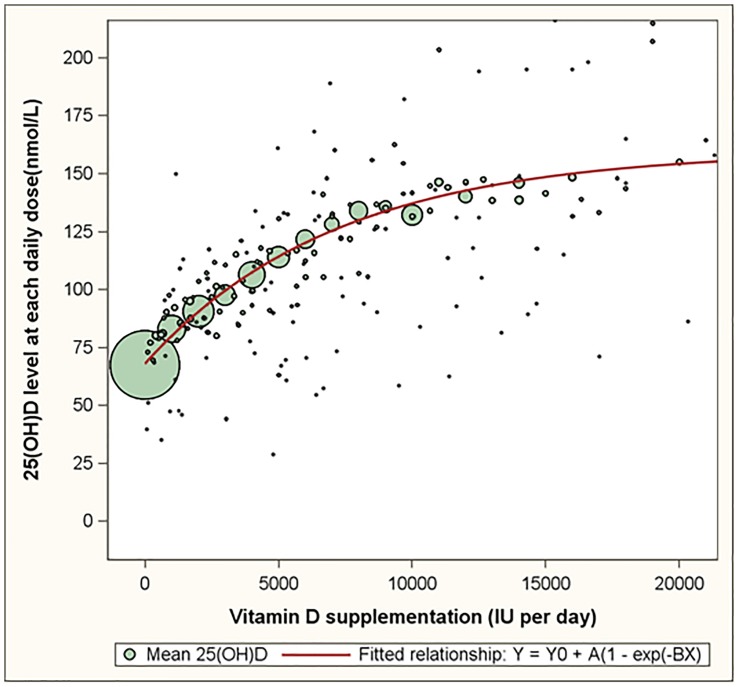
Figure 1. The dose response relationship between oral vitamin D supplementation and serum 25(OH)D levels based on 22,214 observations of healthy volunteers.
Footnote: Bubbles represent the mean plasma 25(OH)D level for all reported daily doses. The size of the bubbles is proportional to the number of assessments for each of the reported daily doses. The red line represents the fitted dose response curve.

