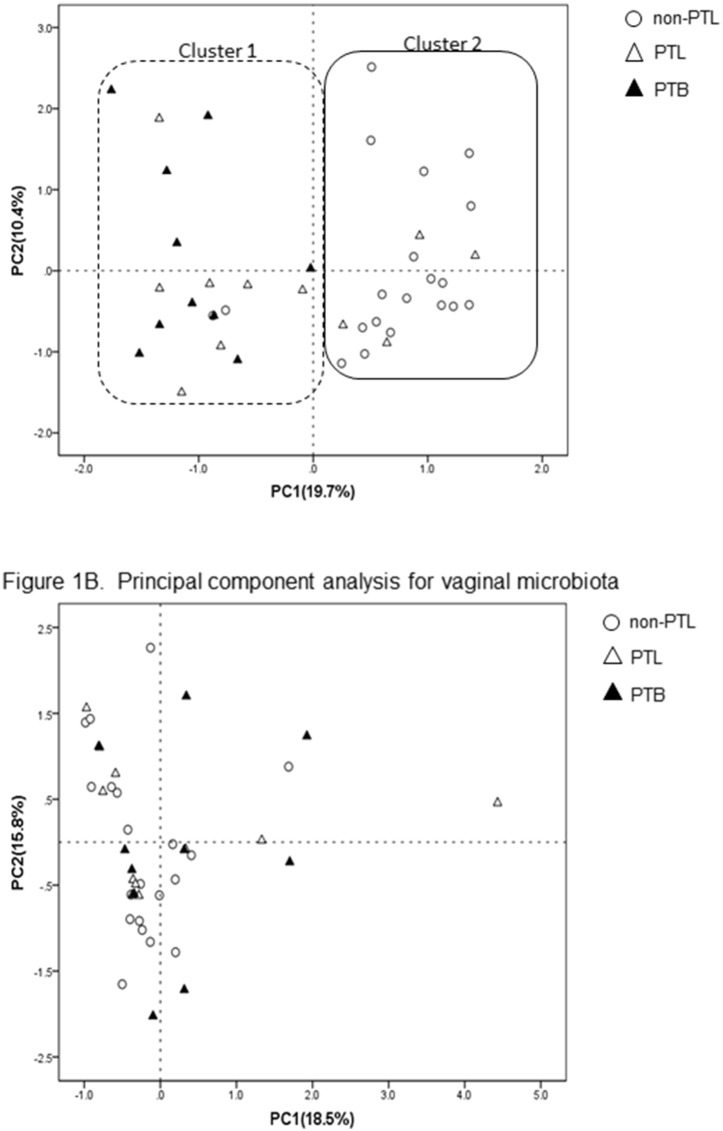
Figure 1.
A. Principal component analysis of fecal microbiota. Principal component analysis scores are plotted based on the relative abundance of OTUs of vaginal microbiota. The percentage of variation explained by the principal coordinates is indicated on the axis. Open circles (○) represent the non-PTL group, open triangles (△) the PTL group, and closed triangles (▴) the PTB group. A dotted line, on the left in Figure 1A, shows ‘cluster 1′, which contains all 10 cases of the PTB group, as well as 2/20 of the non-PTL group and 7/11 of the PTL group. A solid circle, on the right in Figure 1A, shows 90% of the non-PTL group (18/20) and 36.4% of the PTL group (4/11). The PTL group occupied an intermediate position between the non-PTL group and the PTB group. B. Principal component analysis of vaginal microbiota. Principal component analysis scores are plotted based on the relative abundance of OTUs of vaginal microbiota. The percentage of variation explained by the principal coordinates is indicated on the axis. Open circles (○) represent the non-PTL group, open triangles (△) the PTL group, and closed triangles (▴) the PTB group.

