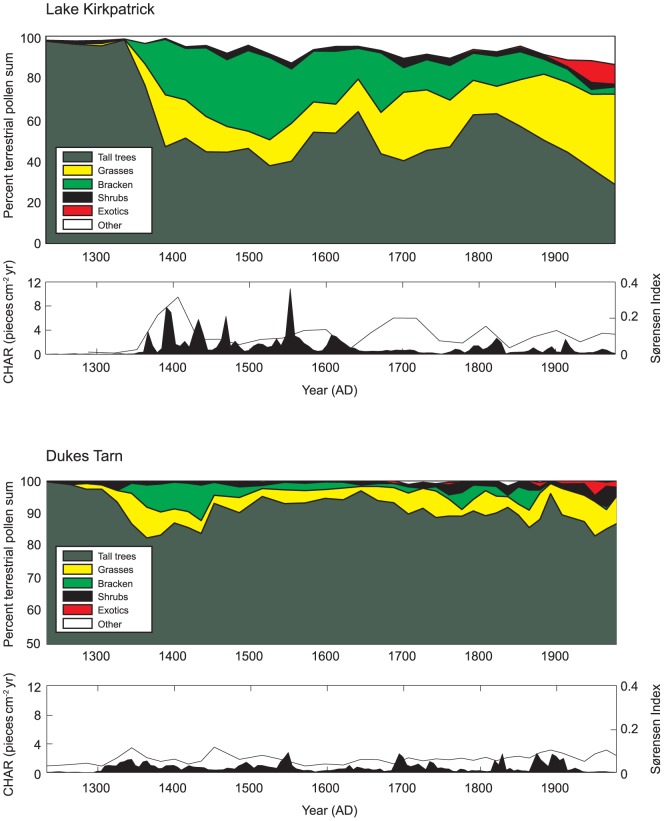
Figure 3. Statistical analysis of vegetation change and rate of vegetation change (based on Sørensen's similarity index) and changes in fire activity (based on CHAR, charcoal particles cm−2 yr−1, and fire event determination), Lake Kirkpatrick and Dukes Tarn.
Colored panels show change in percent of total terrestrial pollen percentages for native trees and disturbance-associated taxa (e.g., Poaceae, Pteridium) and non-native taxa (Pinaceae, Rumex, Taraxacum-type) introduced by Europeans for Lake Kirkpatrick (top) and Dukes Tarn (bottom). Black and white panels show charcoal accumulation rates and Sørensen's distance between each pollen sample and the next oldest pollen sample.

