Abstract
Background
Fetal hemoglobin (HbF) is an important modulator of sickle cell disease (SCD). HbF has previously been shown to be affected by variants at three loci on chromosomes 2, 6 and 11, but it is likely that additional loci remain to be discovered.
Methods and Findings
We conducted a genome-wide association study (GWAS) in 1,213 SCA (HbSS/HbSβ0) patients in Tanzania. Genotyping was done with Illumina Omni2.5 array and imputation using 1000 Genomes Phase I release data. Association with HbF was analysed using a linear mixed model to control for complex population structure within our study. We successfully replicated known associations for HbF near BCL11A and the HBS1L-MYB intergenic polymorphisms (HMIP), including multiple independent effects near BCL11A, consistent with previous reports. We observed eight additional associations with P<10−6. These associations could not be replicated in a SCA population in the UK.
Conclusions
This is the largest GWAS study in SCA in Africa. We have confirmed known associations and identified new genetic associations with HbF that require further replication in SCA populations in Africa.
Introduction
Tanzania has one of the highest number of births of individuals with sickle cell disease (SCD) in the world, estimated to be between 8,000 and 11,000 births a year [1]. Fetal hemoglobin (HbF) is a major ameliorating factor in SCD. Patients with higher HbF levels have less pain [2], [3], lower morbidity and improved survival [2], [4]. The inter-individual HbF variation has been associated with variants at three principal loci [5]–[7]; the region on chromosome 11p that contains the HBB itself [8] and loci on chromosomes 2p (BCL11A) and 6q (HBS1L-MYB intergenic polymorphism, HMIP). Rare variants in KLF1 have also been reported to influence HbF levels [9]. Of the three principal loci influencing HbF, BCL11A variants have been found to be more prevalent in the British, American and Brazilian patients of African descent [6]–[8], [10], [11] than HMIP and HBB variants. Similarly, in Tanzania BCL11A variants (rs11886868 and rs4671393) had the highest overall impact, with rs4671393 alone accounting for up to 12.8% HbF variance [12]. Notably, most of the reported BCL11A variants reside within the intron 2 of the gene [6], , and appear to occur in moderate to high linkage disequilibrium (LD) in African ancestry [15] in Southwest USA (ASW) [17]. This suggests that African populations may be suitable for the identification and fine mapping of the causal variant/s for the BCL11A locus. Together, the 3 loci have been reported to account for up to 50% of HbF variation in non-anemic individuals in Europe [13]. However, a large proportion of HbF variance in African populations remains unaccounted for, that justifies the need for genetic studies of HbF in Africa.
We performed a genome wide association study (GWAS) in 1,213 individuals with SCA in Tanzania to identify new genetic loci associated with HbF levels and any additional variants of the known 3 loci.
Materials and Methods
Study population: Discovery and Replication
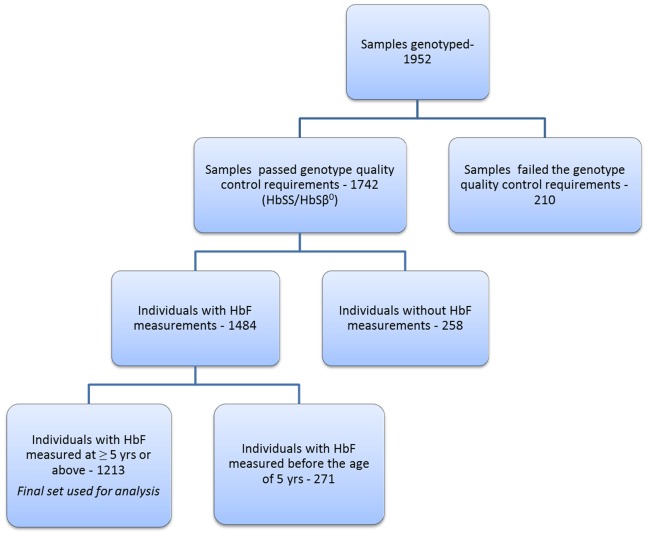
1952 samples were collected and genotyped from individuals who had a diagnosis of SCD. These individuals are part of the Muhimbili Sickle Cohort recruited at Muhimbili National Hospital, Dar es Salaam, Tanzania. At Muhimbili, HbF% measurements are performed by High Performance Liquid Chromatography (HPLC) (Variant I Hemoglobin Testing System, Biorad, Hercules, CA) on all individuals with SCA HbF data used in this study was measured at steady state (defined as malaria test negative, no reported current pain, fever, blood transfusion or hospitalization within 30 days (before or after the date of blood collection). Patients on hydroxyurea and those suspected to be HbS/β+ were excluded from the study. Figure 1 shows the flow of samples at different stages of this study. 1742 SCA (HbSS/HbSβ0) individuals had successful genotype data (see quality control section below) among which 1484 individuals had HbF values collected. For this study we used HbF data collected at five years of age and above. Therefore, a total of 1213 individuals with successful genotype (only HbSS and HbSβ0) and HbF data were included in the discovery cohort. Written informed consent was obtained from patients/guardians and ethical approval was obtained from the Muhimbili University Research and publications committee (MU/RP/AEC/VOL.XIII). The replication cohort included 321 patients (HbSS and HbS/β0) enrolled through the Hematology Outpatient Clinic in King’s College Hospital, London, with written informed consent obtained for all patients. Ethical approval was granted by the King’s College Hospital, London, Local Research Ethics Committee, protocol no 01–083.
Figure 1. A flow chart diagram showing the flow of samples at different stages of the study.
The genetic quality control measures involved removal of individuals with abnormal heterozygosity, gender mismatch, missingness of data, removal of duplicate samples and low quality/rare variants.
Genotyping and replication
DNA was extracted from archived buffy coat samples from patients collected at enrollment using Nucleon BACC II genomic DNA extraction kits from GE Healthcare life sciences. Samples were typed on the Illumina Human Omnichip 2.5 platform (Illumina Inc., San Diego,CA, USA) which assays ∼2.4M Single Nucleotide Polymorphisms (SNPs). For the replication, 16 SNPs from 10 loci were selected and assayed using TaqMan (Applied Biosystems, Foster City, Ca).
Statistical analysis
Quality Control
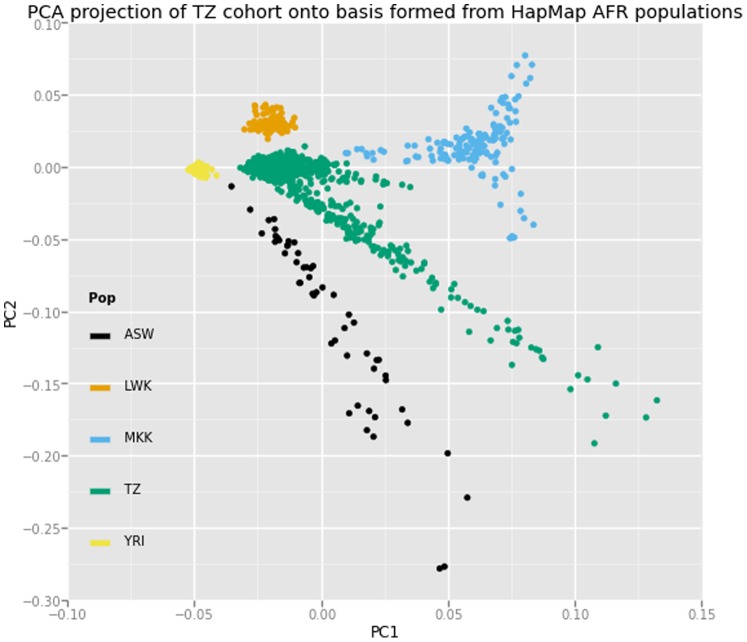
Standard technical QC was performed using PLINK to remove potential sources of technical and genetic bias [18]. A total of 85 samples either found with abnormal heterozygosity (defined as 3 standard deviation from the mean), gender mismatch, and those with more than 3% of missing data were excluded from the study. Following identity-by-descent analysis, we removed duplicate samples and identified individuals in first, second, and third-degree relationships. Principal components analysis (PCA) was performed using EIGENSTRAT with 1000 Genomes Phase 1 populations as reference groups [19]. We observed population substructure and admixture within the cohort (Figure 2), and identified 262 individuals showing clear separation from the core population. Following sample removal, rare and low quality variants (more than 3% data missing,<10−6 Hardy-Weinberg chi-square P-values, and <1% MAF) were excluded, resulting in a typed dataset of 1,827,523 variants in 1,742 individuals.
Figure 2. Principal components plot (PC2 v PC1) with bases formed using genotypes of individuals of African descent included in Hapmap3 study.
ASW: African ancestry in Southwest USA, LWK: Luhya in Webuhe, Kenya, MKK: Maasai in Kinyawa, Kenya, TZ: Tanzanian study population, YRI: Yoruba in Ibadan, Nigeria.
Imputation was performed using IMPUTE 2.0 with the 1000 Genomes Phase I integrated variant set release as the primary reference panel [20]. Low quality imputed variants were removed (<0.4 INFO score and <1% MAF), with 15,153,765 SNPs and indels remained for association testing.
HbF association analysis
We carried out our genome-wide association analysis on the 1213 individuals described above. The distribution of HbF levels was first standardized using three methods: a log transformation, a power transformation with a lambda of 1/3, and empirical normal quantile transformation. The transformation methods yielded consistent results in the later association analyses. In order to take into account population stratification, genetic and cryptic relatedness, we used a linear mixed model framework as implemented in the program MMM [21]. We adjusted for sex and age as fixed covariates, and allowed for a random effect with variance dependent on the genetic relatedness between individuals as determined by a genome-wide panel of SNPs. LD-based clumping was performed using PLINK to identify independent signals amongst variants with suggestive significance (P<10−5). To calculate the variance explained by our top loci, we performed additive regressions in R (http://www.r-projects.org/) using threshold-called genotypes after controlling for sex, age, and 10 principal components. Conditional analyses were performed using MMM with each conditioned variant included as a fixed effect covariate. We generated quantile-quantile (Q-Q) and Manhattan plots using R, and regional association plots using LocusZoom [22].
Results
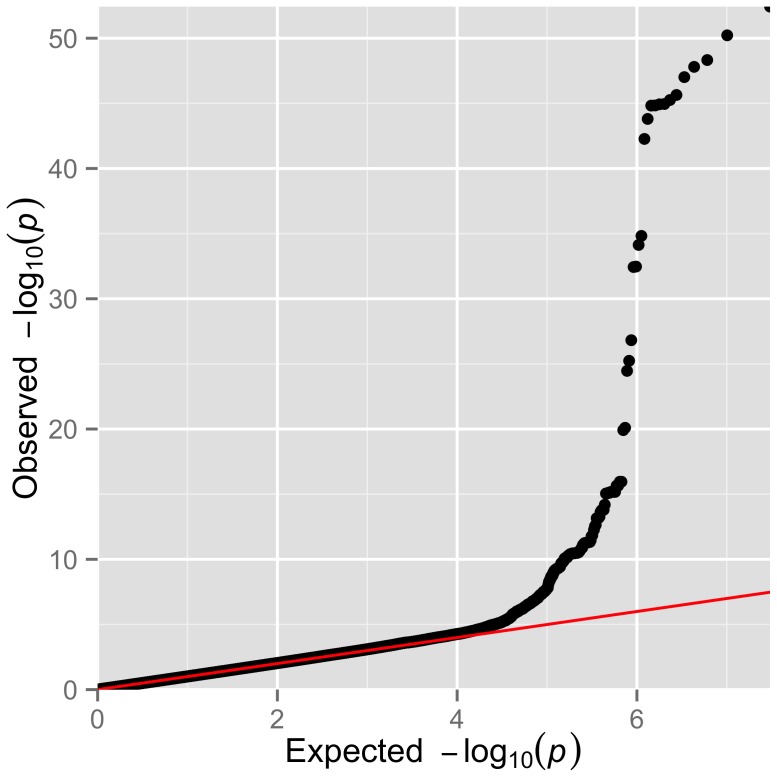
We performed a genome wide association study for HbF in a discovery cohort of 1,213 patients (52.6% females) with SCA and a replication cohort of 321 patients (54.8% females) of African Caribbean descent or West African descent. Details on age, sex and HbF levels are presented in Table 1. The genomic control (λGC) for the analysed SNPs was 1.0156 and a Q–Q plot of the observed versus expected P-values is shown in Figure 3. The absence of an early departure of the observed P-values suggests that our data are not affected by problems with genotyping, imputation, and uncontrolled sample relatedness or population stratification. The distribution of association P-values (Manhattan plot) for HbF level is shown in Figure 4.
Table 1. Characteristics of SCA populations in Tanzania and UK.
| Tanzania | UK | |
| Number | 1,213 | 321 |
| Gender (% female) | 52.6 | 54.8 |
| Age, Y | 11 [IQR: 7.9–16.5] | 25 [IQR:19–36] |
| HbF% | 4.6 [IQR: 2.5–7.7] | 6 [IQR: 2.9–10.3] |
Figure 3. Summary of the genome-wide association results of normalized HbF within Tanzanian individuals with SCA.
Q–Q plot of the observed versus the expected P-values from a linear mixed model for the entire set of 15,153,765 SNPs.
Figure 4. Manhattan plot for normalized HbF association results (-log10P) plotted against the position on each chromosome.
The red horizontal line indicates genome wide suggestive at 5×10⁻⁸ and blue line indicates genome wide suggestive at 1×10⁻⁵.
As in previous genome wide studies, we have strongly replicated 2 loci that have been associated with HbF: near BCL11A (rs1427407, Beta = −0.30, P = 3.74×10−53) on chromosome 2 and the HMIP (rs9494145, Beta = 0.23, P = 2.42×10⁻¹⁰) situated on chromosome 6. Notably, none of the variants situated at the HBB and KLF loci could be replicated in our study. We have detected 8 novel loci with genome wide significance of P<1×10⁻⁶ (Table 2). Of these, the top 3 significant SNPs include; rs28567737 (Beta = −0.12, P = 4.26×10⁻⁸) situated on chromosome 19, rs10468869 (Beta = 0.09, P = 1.33×10⁻⁷) on chromosome 18 and rs62573842 (Beta = 0.11, P = 1.88×10⁻⁷) on chromosome 9. However, none of the novel loci could be validated in our replication set (Table 2).
Table 2. SNPs associated with HbF levels in individuals with SCA in Tanzania and UK.
| Discovery Cohort (n = 1213) Replication Cohort (n = 321) | ||||||||||
| Chr | SNP | Position | Ref/alt allele | Gene | EAF | β-value | P value | EAF | B-value | P-value |
| 2 | rs1427407 | 60718043 | T/G | BCL11A | 0.78 | −0.30 | 3.74×10−53 | 0.55 | −0.36 | 0.003 |
| 6 | rs9494145 | 135432552 | T/C | HBS1L-MYB | 0.05 | 0.23 | 2.42×10¹⁰ | 0.01 | 0.33 | 0.049 |
| 7 | rs6466533 | 78792892 | T/C | MAG12 | 0.24 | 0.10 | 3.59×10 | 0.03 | 0.07 | 0.47 |
| 9 | rs10756993 | 18839724 | A/C | ADAMTSL1 | 0.95 | −0.27 | 2.01×10 | – | – | – |
| 9 | rs62573842 | 32264312 | A/G | 0.20 | 0.11 | 1.88×10 | 0.02 | 0.02 | 0.79 | |
| 11 | rs6590706 | 133334906 | G/A | OPCML | 0.80 | 0.11 | 2.32×10 | 0.61 | 0.08 | 0.34 |
| 14 | rs192197462 | 57582783 | G/A | 0.47 | −0.10 | 2.34×10 | – | – | – | |
| 15 | rs7163278 | 93888391 | T/C | AK094352 | 0.09 | 0.17 | 4.72×10 | 0.02 | 0.09 | 0.38 |
| 18 | rs10468869 | 49321773 | G/A | 0.59 | 0.09 | 1.33×10 | 0.48 | 0.03 | 0.68 | |
| 19 | rs28567737 | 46531219 | T/C | CCDC61/MIR769/ | 0.21 PGLYRPI | −0.12 | 4.26×10 | 0.08 | 0.07 | 0.69 |
Abbreviations: Chr: chromosome, SNP: single nucleotide polymorphism, ref allele: ancestral allele, alt allele: alternative allele, EAF: effect allele frequency, β-value (Beta estimate): the effect that a change in single allele has on the trait,-β indicate a decreasing effect. Chromosomal position (position) given here uses hg19 co-ordinates.
The SNP with the strongest signal (rs1427407, Beta = −0.30, P = 3.74×10−53) was situated in the second intron of BCL11A. Our initial analysis highlighted the presence of several SNPs in LD (R2) with rs1427407 (our top signal). To gain further insight on this region, we performed a stepwise conditional regression analysis (Table 3). After conditioning on rs1427407, there was a significant increase in association at rs6545816 (P = 2.55×10⁻¹⁵ compared to P = 0.58 before conditioning). This finding suggests an independent BCL11A effect that might be tagged by rs6545816. A third conditional analysis using the first two BCL11A variants identified a third candidate variant, rs58955256 with suggestive significance (P = 1.52×10⁻⁶).
Table 3. Association summary of genome wide significant BCL11A SNPs from non-conditional and conditional regression analysis.
| Non-conditional | conditional | |||||||||
| rs1427407 | rs6545816 | |||||||||
| Chr | SNP | BP | ref allele | alt allele | β-value | P-value | β-value | P-value | β-value | P-value |
| 2 | rs58955256 | 60583070 | A | G | −0.10 | 6.95×10 | −0.11 | 1.07×10 | −0.09 | 1.52×10 |
| 2 | rs6545816 | 60714861 | A | C | 0.01 | 0.58 | 0.14 | 2.55×10⁻¹⁵ | – | – |
| 2 | rs1427407 | 60718043 | T | G | −0.30 | 3.74×10−53 | – | – | – | – |
Abbreviations: Chr: chromosome, SNP: single nucleotide polymorphism, ref allele: ancestral allele, alt allele: alternative allele, β-value (Beta estimate): the effect that a change in single allele has on HbF,-β indicate a decreasing effect. Chromosomal position (BP) given here uses hg19 co-ordinates.
Discussion
GWAS have been previously applied in the identification of genetic variants that regulate levels of HbF, both in healthy individuals and those with SCA [5]–[8], [12]. To date, three primary loci; BCL11A, HMIP and HBB at chromosomes 2, 6 and 11 have been reported to account for 20%–50% of HbF inter-individual variation in non-anemic Europeans [13]. However, the contribution of these loci in African populations has been estimated to be lower [8]. Our study represents the first GWAS in 1213 SCA patients from a single site in Africa.
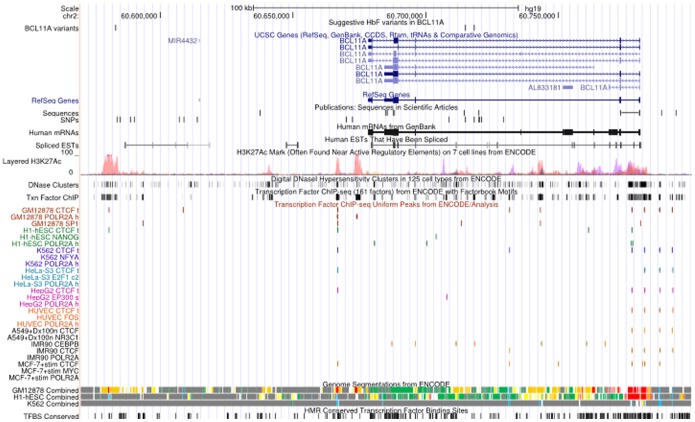
Our findings have confirmed the genetic association of BCL11A and HMIP in the regulation of HbF. Our work also supports the likely causality of rs1427407 at the BCL11A locus, as recently reported [16], as well as the presence of multiple independent risk variants. The rs1427407 falls within a peak of GATA1 andTAL1 binding and the minor T allele is believed to disrupt a composite motif bound by GATA1 [16]. Rs6545816 sits 3kb from rs1427407 while rs58955256 is further upstream of rs1427407 (130 kb). These variants sit near regions with regulative activity within the BCL11A gene (Figure 5), however, their specific functions have not yet been reported and should be considered for further research.
Figure 5. A snapshot of UCSC genome browser showing relevant ENCODE tracks.
The positions of variants reported in this study have been indicated within a track labelled as “suggestive HbF variants in BCL11A”. The positions of variants reported in previous studies.
Although we validated the HMIP association, the allele frequency was extremely low (6%) resulting in a much smaller amount of HbF variance explained by the locus (2.54%) compared to other populations. It is worth noting that this SNP resides within block 2 of HMIP, a region where most of the significant SNPs from other studies are located. The HBB association with HbF was below the genome wide significance level with most variants with P values of x10−5reason for this could be that HBB variants are rare in our population, as reflected in allele frequencies (EAF of less than 5%) reported in our previous study [12] In a study in Cameroon, the HBB variant (rs7482144) studied was also found to be rare (MAF = 0.07) [23]. With a better sample size such as in meta-analyses, it may be possible to improve the association signal. Similarly, the KLF1 association with HbF that has been previously reported [9] was not detected in this study.
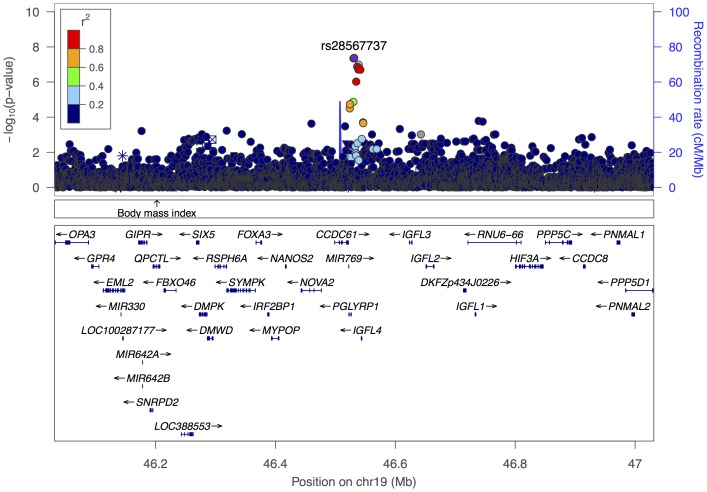
The discovery of additional loci has become increasingly challenging mostly because the effect size of a new locus is likely to be lower than that of the 3 primary loci. Our study has identified 8 suggestive novel SNPs worthy of follow up in larger studies. One of these, rs28567737 on chromosome 19 (Figure 6), was genome-wide significant (4.9×10⁻⁸), and was in high LD (0.991) with rs10414361 (P = 1.31×10⁻⁷), a variant directly typed on the Omni2.5 assay. The lack of validation of the suggestive loci in the UK cohort may be due to the small sample size or different ancestry. The latter is likely to be more significant as most of the UK patients have a Caribbean and West African origin while the population in our study is from East Africa. In addition, studies of SCD suggest that there is a considerable heterogeneity in the genetic and environmental composition of SCD populations within Africa [23], [24] let alone in different continents. Based on differences in ancestry, it is likely that these populations would have different sickle haplotypes with the majority of individuals within the UK cohort carrying the Senegal/Benin haplotype while most of the Tanzanian patients would carry the Bantu/Central African Republic (CAR) in. In addition, HbF regulation pathways may develop differently in different populations [8], hence, allele frequencies may differ across populations. Such a difference has been previously observed for HMIP tag SNP (rs9399137) variant which was found to be less common in the Tanzanian (MAF = 0.01) compared with the UK patients (MAF = 0.07) [12]. In this study we observed lower minor allele frequencies for the suggestive variants within the replication cohort compared to the discovery cohort (Table 2). Another difference observed was high levels of HbF in the UK cohort than those of Tanzanian patients. It is therefore critical that replication studies are done with cohorts within the same geographical region as it is likely that there will be more homogeneity in ancestry. The best replication population for our study would have been from East Africa, however, SCA studies with required HbF data and DNA samples are scarce.
Figure 6. Regional association plot of the chromosome 19 region with our suggestive novel SNP (rs28567737).
The left y axis represents the negative log10 P values of the associations of SNPs in this region. Each SNP is represented by a dot, with grey dots indicating low LD with rs28567737. The right y axis represents the recombination rate (in centimorgans [cM] per megabase [Mb]). Genes found in the region are shown in relative position under the plot; arrows indicate the direction of transcription.
This study highlights the importance of studying disease relevant phenotypes in large populations from individual sites in Africa in order to characterize genetic risk with locale-specific allele frequencies. We believe datasets such as this will form the foundation of international meta-analyses of SCA and other diseases prevalent in Africa.
Acknowledgments
Disclaimer: The findings and conclusions in this report are those of the authors.
The authors thank the patients and staff of Muhimbili National Hospital, Muhimbili University of Health and Allied Sciences and Hematology Outpatient Unit, the genotyping and sample logistics teams at the Wellcome Trust Sanger Institute, King’s College Hospital.
Data Availability
The authors confirm that all data underlying the findings are fully available without restriction. All data are available at the European Genome-phenome Archive (EGA), accession number EGAS00001000990.
Funding Statement
The work was supported by the following: Wellcome Trust, UK (JCB 098051, J.Makani, SEC; strategic award 084538); and Commonwealth split-side fellowship, UK (SNM; TZCN-2012-361). The funders had no role in study design, data collection and analysis, decision to publish, or preparation of the manuscript.
References
- 1. Piel FB, Patil AP, Howes RE, Nyangiri OA, Gething PW, et al. (2013) Global epidemiology of sickle haemoglobin in neonates: a contemporary geostatistical model-based map and population estimates. Lancet 381: 142–151. [DOI] [PMC free article] [PubMed] [Google Scholar]
- 2. Platt OS, Thorington BD, Brambilla DJ, Milner PF, Rosse WF, et al. (1991) Pain in sickle cell disease. Rates and risk factors. N Engl J Med 325: 11–16. [DOI] [PubMed] [Google Scholar]
- 3. Dampier C, Ely E, Eggleston B, Brodecki D, O'Neal P (2004) Physical and cognitive-behavioral activities used in the home management of sickle pain: A daily diary study in children and adolescents. Pediatr Blood Cancer 43: 674–678. [DOI] [PubMed] [Google Scholar]
- 4. Platt OS, Brambilla DJ, Rosse WF, Milner PF, Castro O, et al. (1994) Mortality in sickle cell disease. Life expectancy and risk factors for early death. N Engl J Med 330: 1639–1644. [DOI] [PubMed] [Google Scholar]
- 5. Thein SL, Menzel S, Lathrop M, Garner C (2009) Control of fetal hemoglobin: new insights emerging from genomics and clinical implications. Hum Mol Genet 18: R216–223. [DOI] [PMC free article] [PubMed] [Google Scholar]
- 6. Lettre G, Sankaran VG, Bezerra MA, Araujo AS, Uda M, et al. (2008) DNA polymorphisms at the BCL11A, HBS1L-MYB, and beta-globin loci associate with fetal hemoglobin levels and pain crises in sickle cell disease. Proc Natl Acad Sci U S A. 105: 11869–11874. [DOI] [PMC free article] [PubMed] [Google Scholar]
- 7. Creary LE, Ulug P, Menzel S, McKenzie CA, Hanchard NA, et al. (2009) Genetic variation on chromosome 6 influences F cell levels in healthy individuals of African descent and HbF levels in sickle cell patients. PLoS One 4: e4218. [DOI] [PMC free article] [PubMed] [Google Scholar]
- 8. Solovieff N, Milton JN, Hartley SW, Sherva R, Sebastiani P, et al. (2010) Fetal hemoglobin in sickle cell anemia: genome-wide association studies suggest a regulatory region in the 5′ olfactory receptor gene cluster. Blood 115: 1815–1822. [DOI] [PMC free article] [PubMed] [Google Scholar]
- 9. Borg J, Patrinos GP, Felice AE, Philipsen S (2011) Erythroid phenotypes associated with KLF1 mutations. Haematologica 96: 635–638. [DOI] [PMC free article] [PubMed] [Google Scholar]
- 10. Uda M, Galanello R, Sanna S, Lettre G, Sankaran VG, et al. (2008) Genome-wide association study shows BCL11A associated with persistent fetal hemoglobin and amelioration of the phenotype of beta-thalassemia. Proc Natl Acad Sci U S A 105: 1620–1625. [DOI] [PMC free article] [PubMed] [Google Scholar]
- 11.Sedgewick AE, Timofeev N, Sebastiani P, So JC, Ma ES, et al.. (2008) BCL11A is a major HbF quantitative trait locus in three different populations with beta-hemoglobinopathies. Blood Cells Mol Dis. [DOI] [PMC free article] [PubMed]
- 12. Makani J, Menzel S, Nkya S, Cox SE, Drasar E, et al. (2011) Genetics of fetal hemoglobin in Tanzanian and British patients with sickle cell anemia. Blood 117: 1390–1392. [DOI] [PMC free article] [PubMed] [Google Scholar]
- 13. Menzel S, Garner C, Gut I, Matsuda F, Yamaguchi M, et al. (2007) A QTL influencing F cell production maps to a gene encoding a zinc-finger protein on chromosome 2p15. Nat Genet 39: 1197–1199. [DOI] [PubMed] [Google Scholar]
- 14. Nuinoon M, Makarasara W, Mushiroda T, Setianingsih I, Wahidiyat PA, et al. (2010) A genome-wide association identified the common genetic variants influence disease severity in beta0-thalassemia/hemoglobin E. Hum Genet. 127: 303–314. [DOI] [PubMed] [Google Scholar]
- 15. Bhatnagar P, Purvis S, Barron-Casella E, DeBaun MR, Casella JF, et al. (2011) Genome-wide association study identifies genetic variants influencing F-cell levels in sickle-cell patients. J Hum Genet 56: 316–323. [DOI] [PMC free article] [PubMed] [Google Scholar]
- 16. Bauer DE, Kamran SC, Lessard S, Xu J, Fujiwara Y, et al. (2013) An erythroid enhancer of BCL11A subject to genetic variation determines fetal hemoglobin level. Science 342: 253–257. [DOI] [PMC free article] [PubMed] [Google Scholar]
- 17. Consortium TIH (2005) A haplotype map of the human genome. Nature 437: 1299–1320. [DOI] [PMC free article] [PubMed] [Google Scholar]
- 18. Purcell S, Neale B, Todd-Brown K, Thomas L, Ferreira MA, et al. (2007) PLINK: a tool set for whole-genome association and population-based linkage analyses. Am J Hum Genet 81: 559–575. [DOI] [PMC free article] [PubMed] [Google Scholar]
- 19. Price AL, Patterson NJ, Plenge RM, Weinblatt ME, Shadick NA, et al. (2006) Principal components analysis corrects for stratification in genome-wide association studies. Nat Genet 38: 904–909. [DOI] [PubMed] [Google Scholar]
- 20. Howie BN, Donnelly P, Marchini J (2009) A flexible and accurate genotype imputation method for the next generation of genome-wide association studies. PLoS Genet 5: e1000529. [DOI] [PMC free article] [PubMed] [Google Scholar]
- 21. Pirinen D (2013) Spencer (2013) Efficient computation with a linear mixed model on large-scale data sets with applications to genetic studies. The Annals of Applied Statistics 7: 369–390. [Google Scholar]
- 22. Pruim RJ, Welch RP, Sanna S, Teslovich TM, Chines PS, et al. (2010) LocusZoom: regional visualization of genome-wide association scan results. Bioinformatics 26: 2336–2337. [DOI] [PMC free article] [PubMed] [Google Scholar]
- 23. Wonkam A, Ngo Bitoungui VJ, Vorster AA, Ramesar R, Cooper RS, et al. (2014) Association of Variants at BCL11A and HBS1L-MYB with Hemoglobin F and Hospitalization Rates among Sickle Cell Patients in Cameroon. PLoS One. 9: e92506. [DOI] [PMC free article] [PubMed] [Google Scholar]
- 24. Nagel RL, Fleming AF (1992) Genetic epidemiology of the beta s gene. Baillieres Clin Haematol 5: 331–365. [DOI] [PubMed] [Google Scholar]
Associated Data
This section collects any data citations, data availability statements, or supplementary materials included in this article.
Data Availability Statement
The authors confirm that all data underlying the findings are fully available without restriction. All data are available at the European Genome-phenome Archive (EGA), accession number EGAS00001000990.


