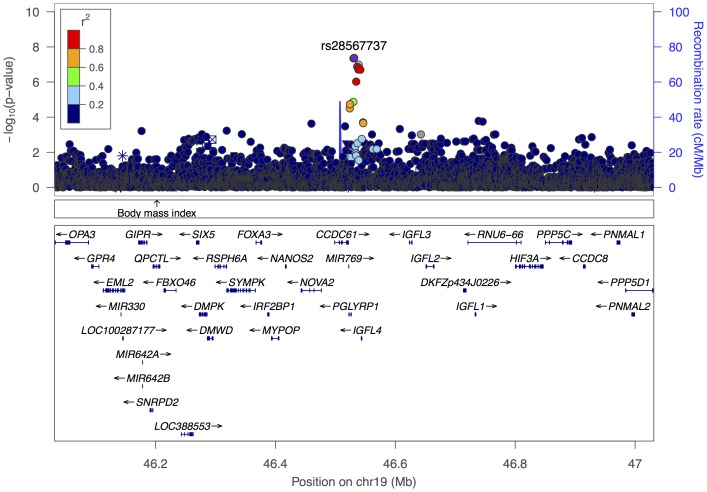
Figure 6. Regional association plot of the chromosome 19 region with our suggestive novel SNP (rs28567737).
The left y axis represents the negative log10 P values of the associations of SNPs in this region. Each SNP is represented by a dot, with grey dots indicating low LD with rs28567737. The right y axis represents the recombination rate (in centimorgans [cM] per megabase [Mb]). Genes found in the region are shown in relative position under the plot; arrows indicate the direction of transcription.

