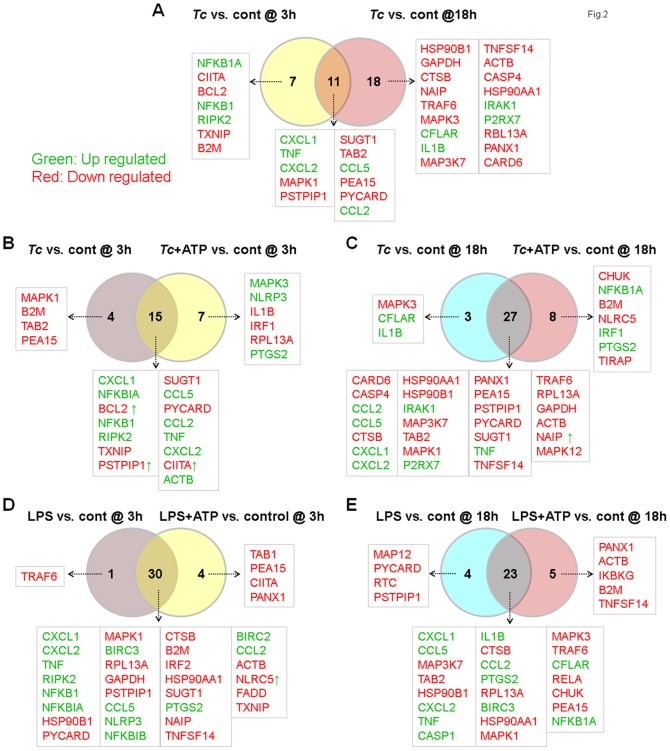
Figure 2. Venn diagram of inflammasome-related differential gene expression in mφs infected with T. cruzi (±ATP).
THP-1 mφs were incubated with T. cruzi or LPS (± ATP treatment) as in Fig. 1. Total RNA was isolated, and cDNA was used as a template to probe the expression of 95 genes (including house-keeping genes) in the RT2 Profiler Inflammasome PCR Arrays. The differential mRNA level was captured by quantitative RT-PCR, normalized to housekeeping genes, and HTqPCR was employed to attain the statistically significant differential expression in treated- versus-control samples (Table 1 and Table S2). Shown are Venn diagrams of comparative analysis of gene expression in T. cruzi-infected mφs at 3 h versus 18 h (A), effect of ATP stimulus on gene expression at 3 h (B) and 18 h (C) pi, and comparative effect of ATP stimulus on gene expression in LPS-treated mφs at 3 h (D) and 18 h (E). Differential up-regulation (green) and down-regulation (red) of genes with respect to controls is presented. Genes presenting as red with green arrow in B–F showed decreased expression without ATP but were up-regulated by ATP treatment (and vice versa).

