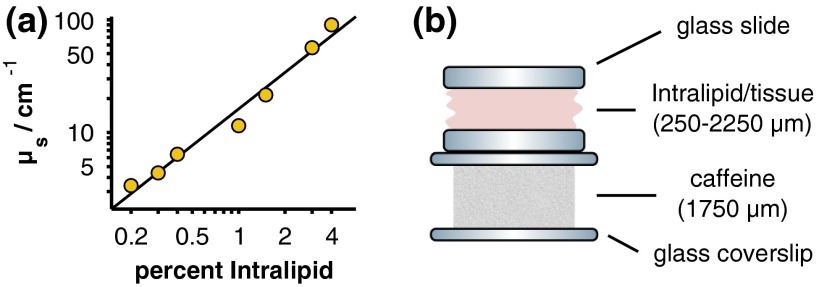
Fig. 2.
(a) Calculated scattering coefficients for the Intralipid scattering phantoms (yellow circles) along with a linear least-squares fit to the logarithm-transformed data (black line). Error bars are omitted because they are smaller than the size of the markers. (b) Measurement geometry and thicknesses of the scattering sample (Intralipid/tissue) and caffeine powder target.

