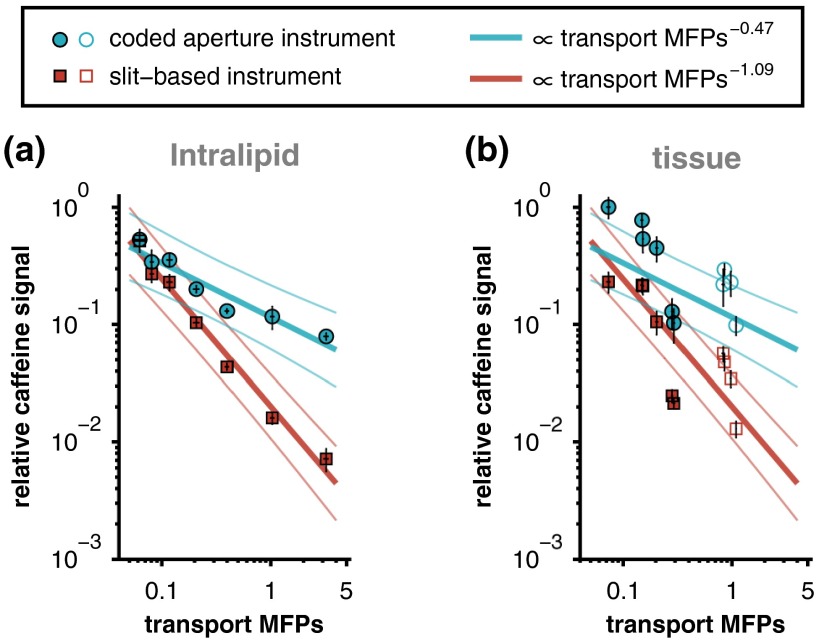
Fig. 5.
Relative caffeine signal versus transport MFPs for the (a) Intralipid phantoms and (b) tissue samples. Data from both the chicken breast (filled markers) and porcine buccal (open markers) tissues are included in panel (b). The solid lines in panel (a) represent linear least-squares fits (along with 95% confidence intervals) of the logarithm-transformed Intralipid data. The Intralipid fits are plotted again in panel (b) for comparison to the tissue data. Error bars represent 95% confidence intervals for the mean of each measurement.

