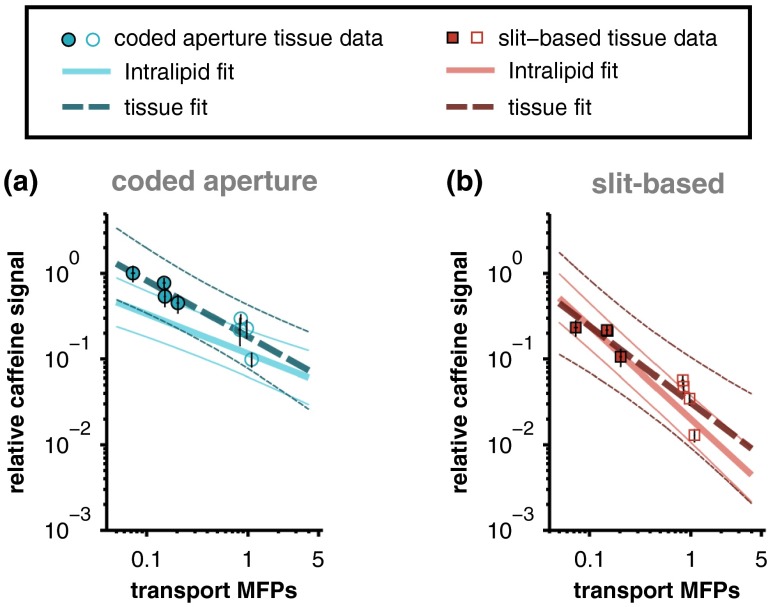
Fig. 6.
Comparison of the least-squares fits to the Intralipid data with the corresponding fits to the truncated chicken breast (filled markers) and porcine buccal (open markers) tissue data. The thick lines represent linear least-squares fits (thin lines are 95% confidence intervals) of the logarithm-transformed data and error bars represent 95% confidence intervals for the mean of each measurement. The difference in the slopes of the tissue and Intralipid fits associated with each instrument is not statistically significant.

