Figure 2.

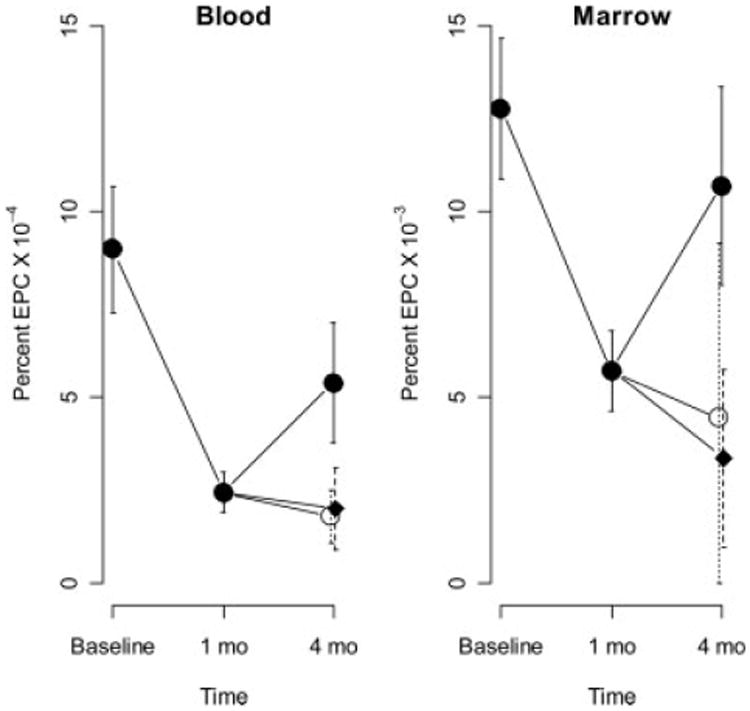
Mean EPC levels across time in blood and marrow. Vertical lines indicate standard errors for the combined groups at baseline and 1 month, and for control: rectangles, atorvastatin closed circles, ezetimibe open circles at 4 months.

Mean EPC levels across time in blood and marrow. Vertical lines indicate standard errors for the combined groups at baseline and 1 month, and for control: rectangles, atorvastatin closed circles, ezetimibe open circles at 4 months.