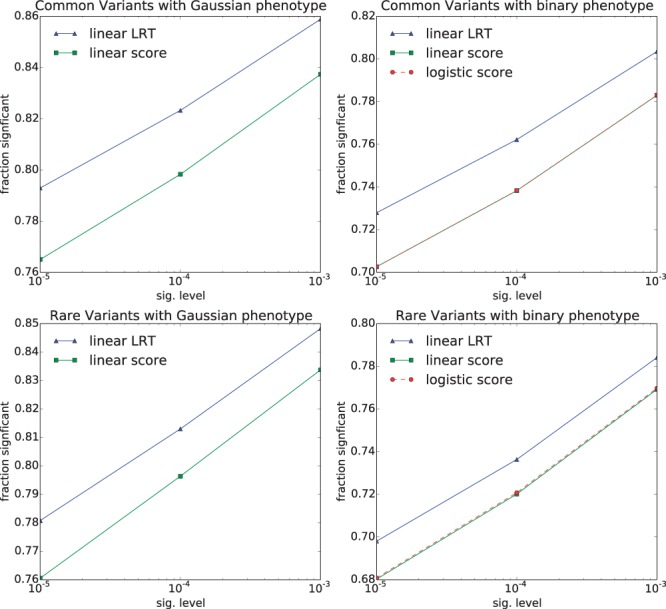
Fig. 2.

Power on synthetic data for each method in each setting, for signal strength, . Fraction of tests deemed significant across various significance levels for each method is shown on the vertical axis. The threshold for significance is shown on the horizontal axis. Other signal strengths are shown in Figure 1 and Supplementary Figures S1 and S2
