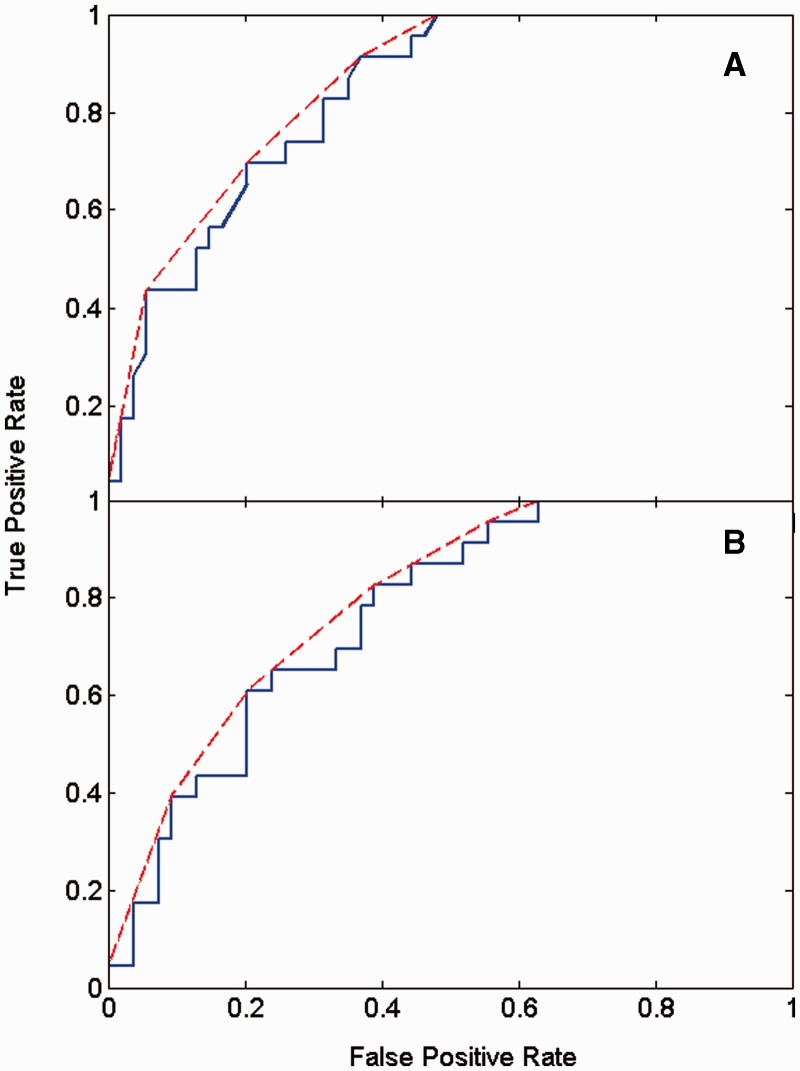
Fig. 3.
ROC curves for the prediction of hinge and shear using logistic regression. A predictor for shear and hinge was constructed and tested against predominantly shear and predominantly hinge assignments in the DBMM. The ROC curve for the logistic function, given in Equation 4, gives the unbroken line; the convex hull of the unbroken line is the broken line. (A) The area under the ROC curve is 0.83, and the area under the convex hull is 0.86. (B) The ROC curve for a leave-one-out cross-validation approach. The area under the ROC curve is 0.77, and the area under the convex hull, 0.80

