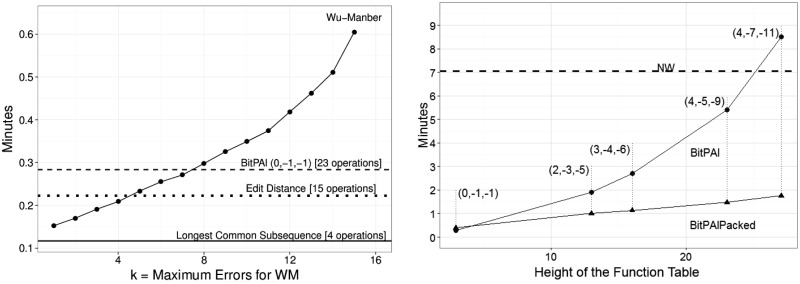
Fig. 10.
Running times. Each experiment involved 25 million alignments. For BitPAl and BitPAl Packed, alignment weights (M, I, G) are shown in parenthesis. All times are averages of three runs. Left: unit-cost BitPAl, unit-cost WM, LCS and ED. k is the maximum number of errors allowed for WM. k is not a parameter for the other algorithms and their times are shown as horizontal lines. LCS uses 4 bit operations per w cells, ED uses 15 bit operations, BitPAl (0, −1, −1) uses 23 bit operations. For k = 7, the times for BitPal and WM are nearly the same. By k = 15, BitPAl runs approximately twice as fast. Results for N are not shown on the graph. It was 118–304 times slower than BitPAl (0, −1, −1) even when optimal parameters were chosen. Right: variants of BitPAl and NW (shown as a horizontal line). For BitPAl, time is approximately linearly proportional to one dimension of the function table. For BitPAl packed, time is approximately linearly proportional to the area of the function tables. BitPAl packed (2, −3, −5) is ∼7.1 times faster than NW and BitPAl (0, −1, −1) is ∼24.9 times faster

