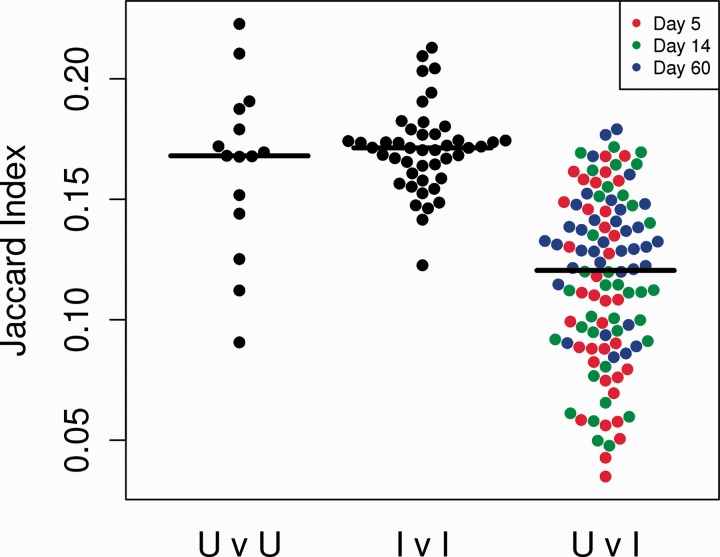
Fig. 2.
The similarity (Jaccard) index comparing all pairs of mice. Each dot represents the Jaccard index comparing all CDR3 sequences from two mice. CDR3 repertoires from pairs of untreated (U) mice, or pairs of immunized (I) mice, display greater similarity (i.e. have a larger Jaccard index) than repertoires from pairs of mice where one mouse is immunized and one is not immunized. Horizontal black lines indicate mean of each population

