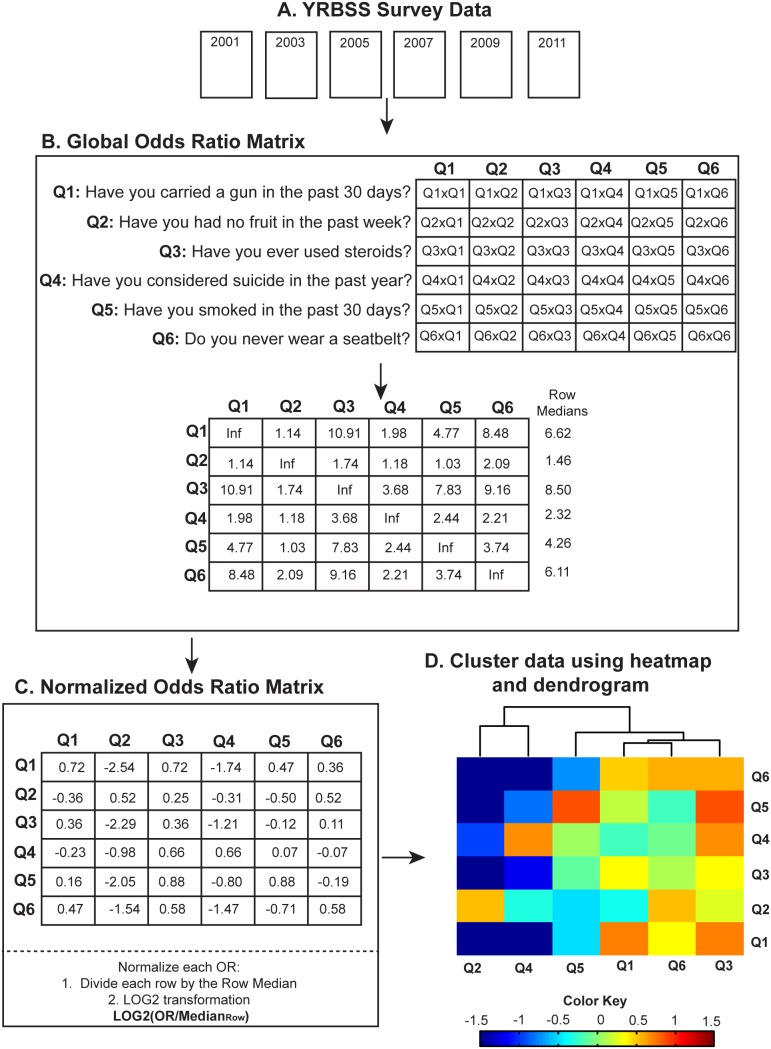
Figure 1. Data analysis framework.
(a) YRBSS data was processed for each question, including conversion from categorical to binary, data weighting, reverse coding and the removal of missing values. (b) Odds ratios (ORs) for each question combination were calculated and stored as a branching odds ratio matrix. ORs comparing the same question (i.e. Q1xQ1, Q2xQ2, etc) are indicated as infinity (Inf) and replaced by the maximum value in the row for all subsequent analysis. (c) The global odds ratio matrix was then normalized by dividing by the median value of each row (Row 1 = 6.62, Row2 = 1.46, etc.) and LOG2 transformation. (D) The normalized global odds ratio matrix was then used in hierarchical clustering of each risk behavior, and shown as a heatmap (with colors indicating associated normalized odds ratios) and dendrogram (indicating the similarity of each behavior to one another).

