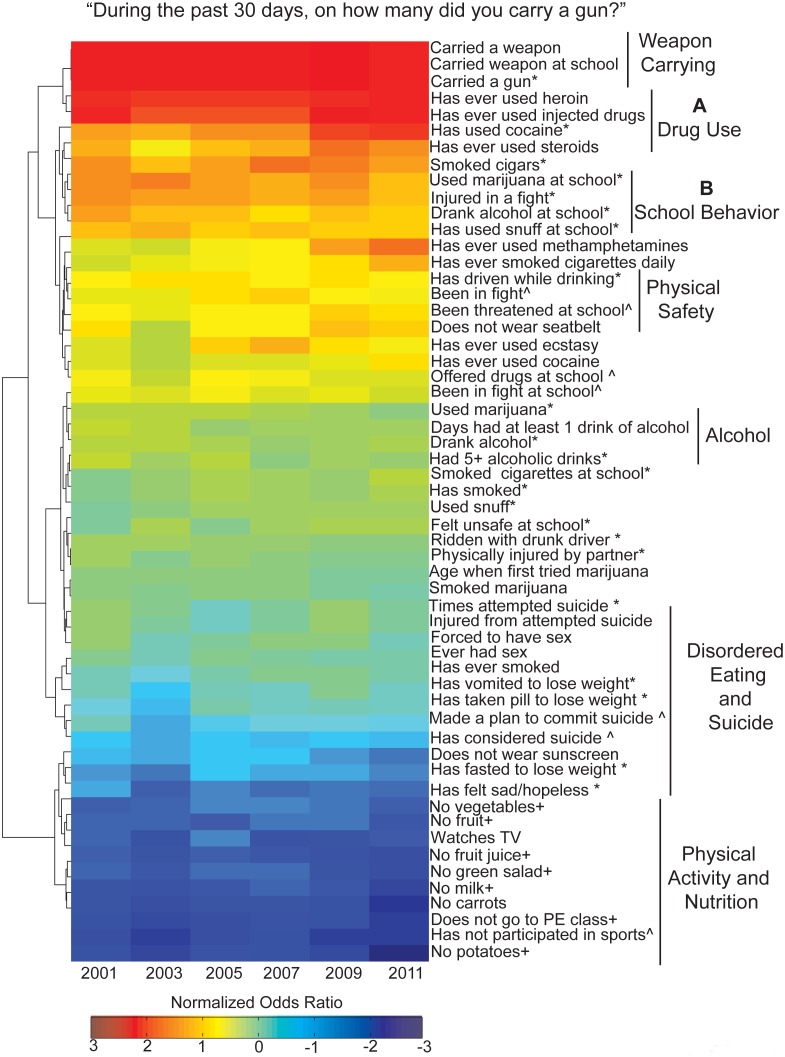
Figure 3. Gun possession odds ratio hierarchical clustering identifies highest and lowest risk behavior associations.
Hierarchical clustering, dendrogram and heat map based on odds ratios for weapon carrying and each of the 55 risk questions for each survey year between 2001–2011. Each row corresponds to a survey year. Data was median centered across rows, log2 normalized, clustered along columns and rotated for better visualization (+ in the past week; * in the past month; ∧ in the past year).

