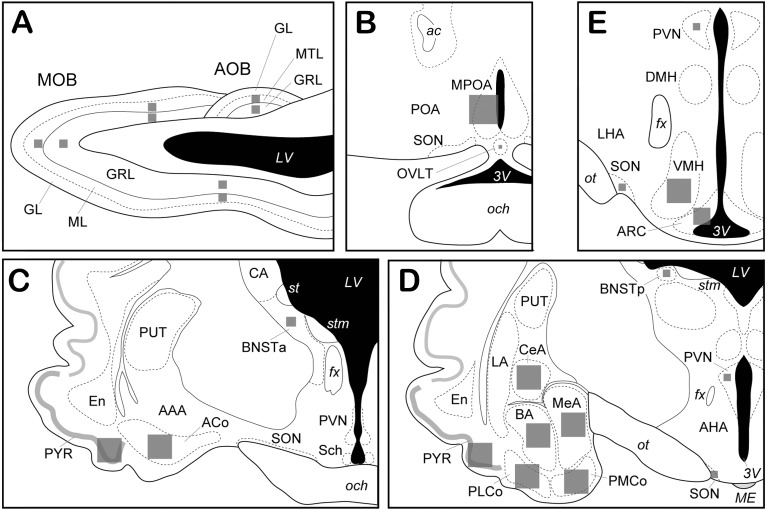
Fig. 2.
Schematic illustrations of brain regions. A, a sagittal view of the olfactory bulb. B–E, coronal views of the hypothalamus and the amygdaloid complex (the rostro-caudal order). Gray squares schematically show the areas in which the number of c-Fos positive cells was counted in each brain region. AAA, anterior amygdaloid area; ACo, anterior cortical amygdala; AHA, anterior hypothalamic area; AOB, accessory olfactory bulb; ARC, arcuate nucleus; BA, basal amygdala, BNSTa, anterior part of the bed nucleus of the stria terminalis; BNSTp, posterior part of the bed nucleus of the stria terminalis; CA, caudate nucleus; CeA, central amygdala; DMH, dorsomedial hypothalamic nucleus; En, endopiriform nucleus; LA, lateral amygdala; LHA, lateral hypothalamic area; MeA, medial amygdala; MOB, main olfactory bulb; MPOA, medial preoptic area; OVLT, vascular organ of the lamina terminalis; PMCo, posterior medial cortical amygdala; PLCo, posterior lateral cortical amygdala; POA, preoptic area; PUT, putamen; PVN, paraventricular nucleus of the hypothalamus; PYR, piriform cortex; Sch, suprachiasmatic nucleus; SON, supraoptic nucleus; VMH, ventromedial hypothalamic nucleus, GL, glomerular layer; GRL, granule cell layer; ML, mitral cell layer; MTL, mitral/tufted cell layer; ac, anterior commissure; fx, fornix; och, optic chiasm; ot, optic tract; st, stria terminalis; stm, stria medullaris of the thalamus; LV, lateral ventricle; ME, median eminence; 3V, third ventricle.

