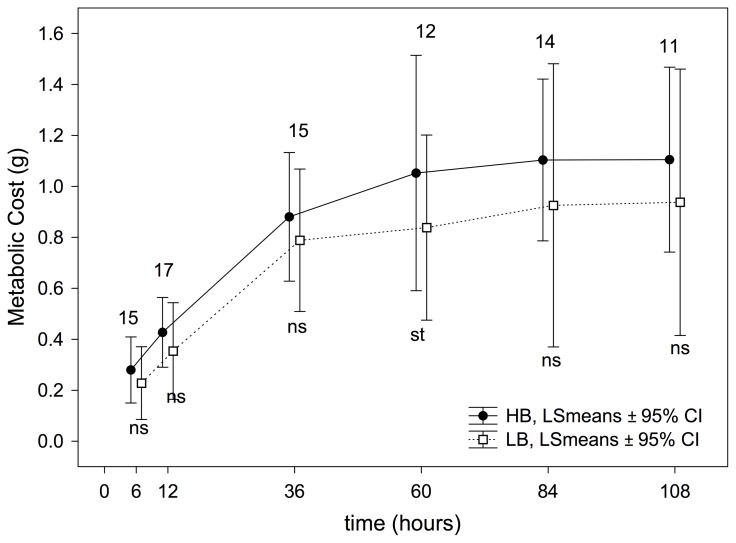
Figure 7. Effect of the experimental treatment on metabolic costs of nestlings based on the RM-ANOVAs performed in each experimental session.
P-values are indicated as ns: P>0.05; st: 0.1≤P≥0.05; *: P<0.05; **: P<0.001 and ***: P<0.0001. Numbers of nests (i.e. those with measurements from the four nestlings) used in each comparison are also shown.

