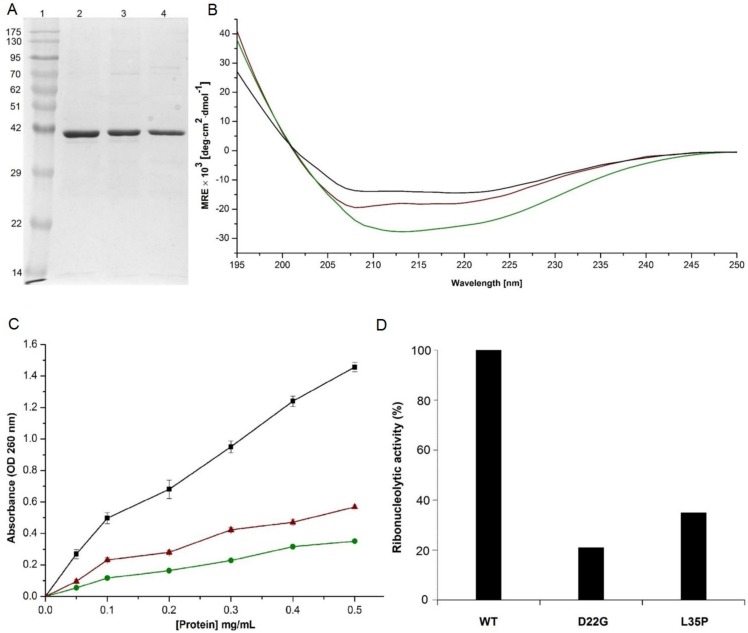
Figure 3. Purification, secondary structure depiction and ribonucleolytic activity of wild-type Angiogenin-GST and mutants.
A) Coomassie stained SDS-PAGE gel showing wild-type Angiogenin-GST (lane 2), D22G (lane 3) and L35P (lane 4) proteins after Ni-NTA affinity purification. Lane 1 contains molecular weight markers. The Angiogenin proteins (14.1 kDa) are all tagged with Glutathione S-transferase (GST, ∼26 kDa) for soluble expression in E. coli. B) Plot showing CD spectra for wild-type (black), D22G (green), and L35P (brown) Angiogenin-GST proteins. Samples were diluted in PBS to yield a concentration of 0.4 mg/ml; three spectra were recorded, averaged and plotted after subtracting the buffer baseline for each sample. C) Ribonucleolytic activity of wild-type (black), D22G (green) and L35P (red) Angiogenin-GST proteins measured using yeast tRNA as substrate. The proteins, at concentrations of 0.05 to 0.5 mg/ml, were incubated with yeast tRNA (2 mg/ml) at 37°C for 2 hours. Undigested tRNA was precipitated by addition of ice-cold perchloric acid, and the absorbance of the supernatents was measured at 260 nm; data were collected from three independent experiments for each protein concentration. Student’s t-test of three independent experiments shows that the difference between wild-type and each of the three mutant protein is significant (n = 3; p<0.05). D) The loss of ribonucleolytic activity of D22G and L35P mutants compared to wild-type Angiogenin-GST. The amount of protein required to generate 1.0 optical density (OD) is compared with wild-type Angiogenin-GST to generate same OD unit for mutants.

