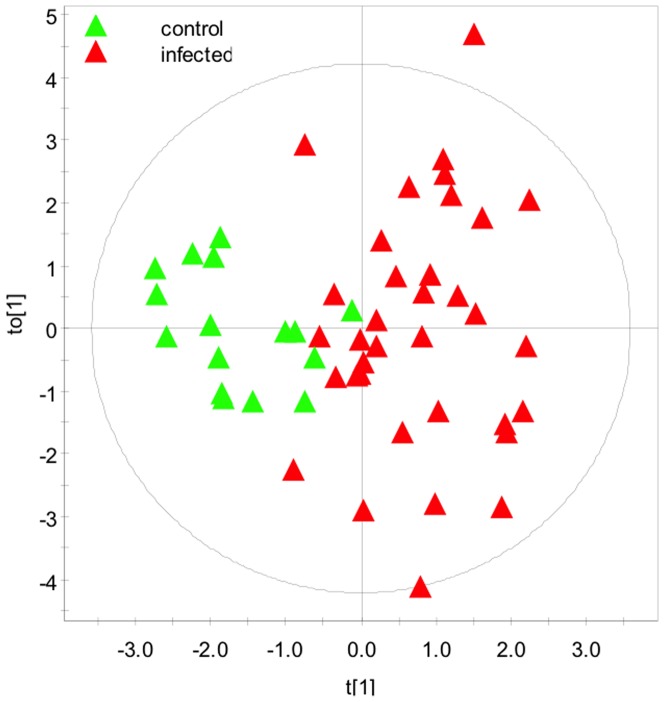
Figure 3. 2D supervised OPLS-DA scores plot demonstrating the clustering pattern obtained for animals with known discrete infection status in dairy calves exactly 1-year-old dairy calves (R2Y = 0.65, Q2Y = 0.52).
The metabolites were trimmed to the 16 most discriminating ones based on an analysis including all 53 metabolites.

