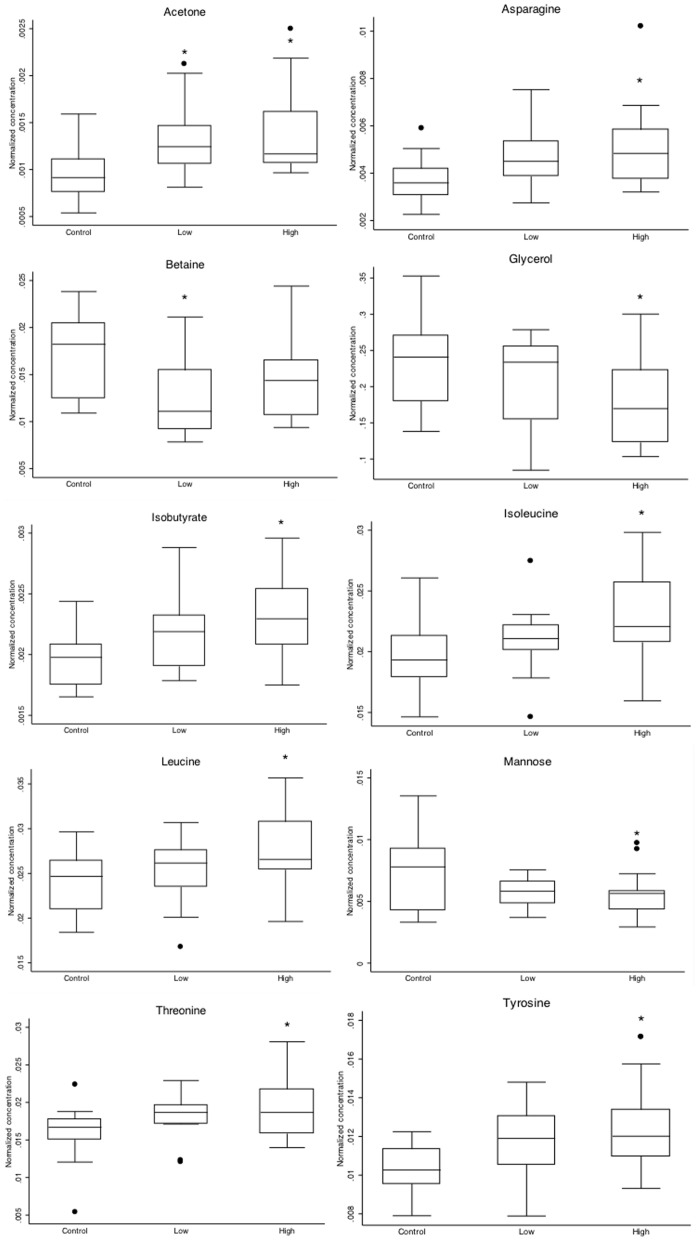
Figure 7. Boxplots of selected metabolites (acetone, asparagine, aspartate, betaine, glycerol, isobutyrate, isoleucine, leucine, mannose, threonine, tyrosine) for MAP-infected animals (n = 35) and non-infected age matched controls (n = 16).
Significant differences with the control group by posthoc testing (Scheffe) after ANOVA are indicated by * (P<0.05).

