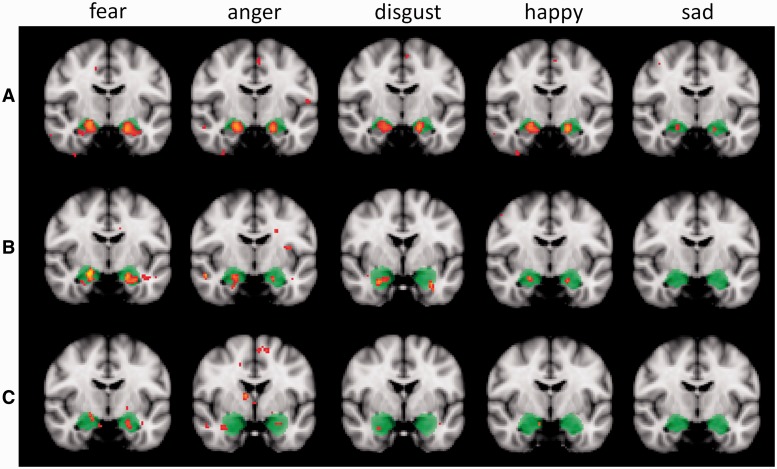
Fig. 2.
Statistical significance maps thresholded at Z > 2.6 (P < 0.005) depicting amygdala activation in each facial expression condition vs the three comparison conditions: buildings (A), 25% happy faces (B) and neutral faces (C). The amygdala region is anatomically defined with the 5–100% masks from the Harvard-Oxford sub-cortical probability atlas and it is highlighted in the figure in green colour. Images follow the radiological convention with the right hemisphere represented on the left side. For each contrast the cursor was positioned on the peak voxel in the left amygdala. Fear and anger showed a significantly higher response when compared to all control conditions.

