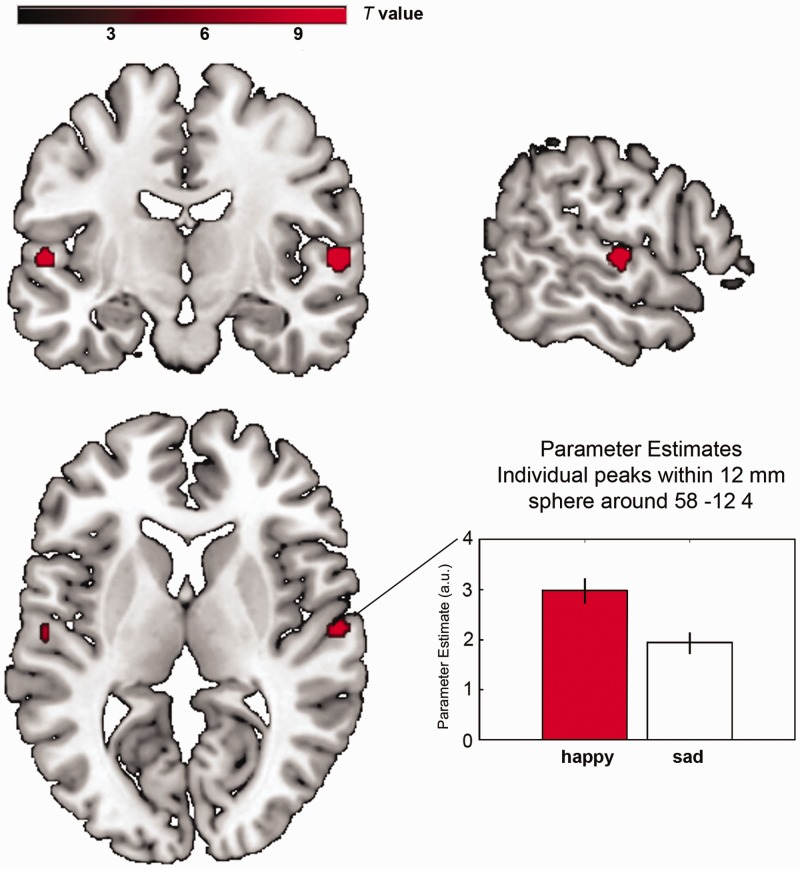
Fig. 3.
Regional brain activations. The emotion effect of music (happy > sad) is located in the aSTG. The plot shows parameter estimates including betas at the individual peak within a 12 mm sphere around the group peak in the right aSTG with error bars indicating standard errors. All activations depicted P < 0.05 FWE whole-brain corrected, cluster extent threshold k > 5 voxels. Maximum t values in the left hemisphere t = 10.11 and in the right hemisphere t = 10.43. Coordinates are listed in Table 2.

