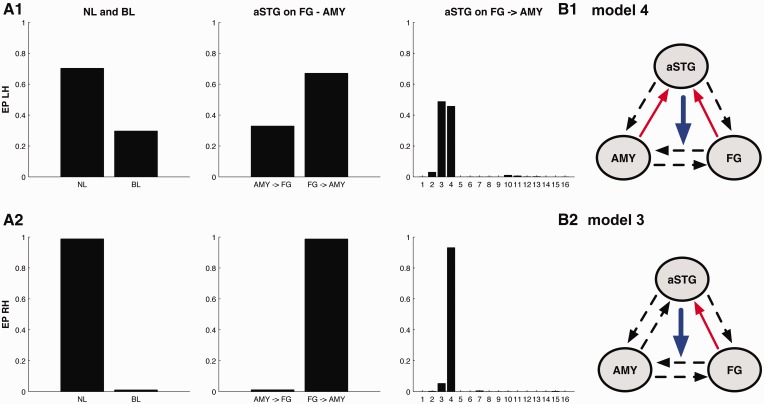
Fig. 4.
Bayesian model selection. Results of Bayesian model selection for the left Hemisphere (LH, A1) and the right hemisphere (RH, A2). EP are reported as a measure of relative model fit. From left to right: Family selection of bilinear (BL) and non-linear (NL) model families, family selection of the two non-linear families: aSTG on AMY to FG connectivity (AMY ⇒ FG) and aSTG on FG to AMY connectivity (FG ⇒ AMY) and model selection for the model-subspace containing 16 models with all possible combinations of happy and sad music modulation. The winning models are number 3 (B2—model 3) and 4 (B1—model 4) for the left hemisphere and model 4 (B1—model 4) for the right hemisphere with backward projections from AMY and FG to aSTG.

