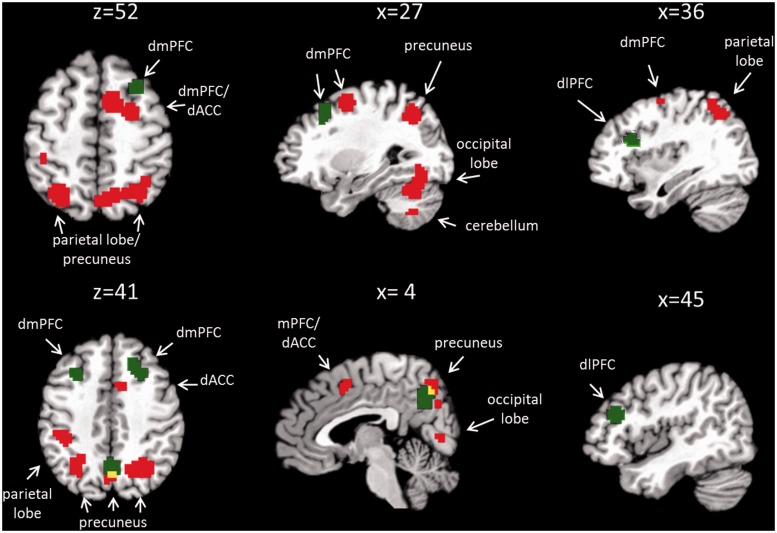
Fig. 1.
Overlay of main effect of ‘group’ (red) and interaction effect of ‘group × condition’ (green). Red blobs correspond to brain regions with increased activation in the BPD group compared with HC independent of the social condition. Green blobs correspond to brain regions differing between groups depending on the type of social interaction condition. Overlap between main effect of ‘group’ and interaction effect of ‘group × condition’ is represented in yellow. dmPFC: dorsal medial prefrontal cortex, dlPFC: dorsolateral prefrontal cortex, dACC: dorsal anterior cingulate cortex.

