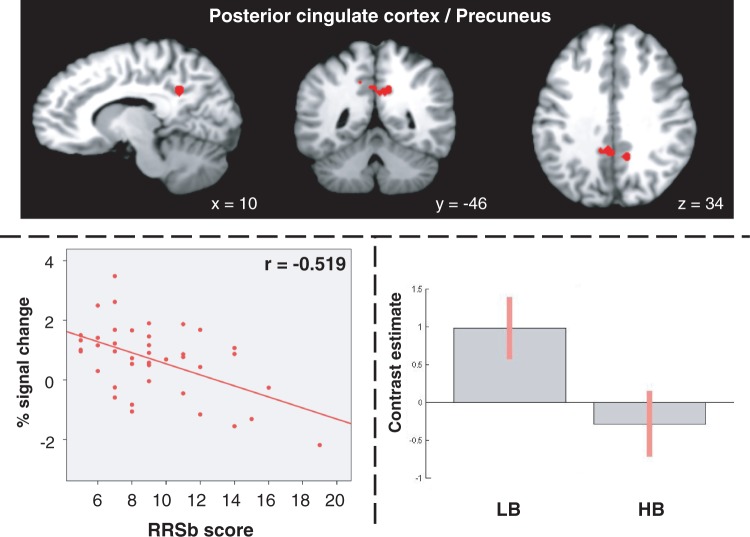
Fig. 2.
Images (top panel) and scatter plot (bottom left panel) show the posterior cingulate/precuneus region whose activation during analytical vs experiential self-focus is negatively correlated with the RRSb score (20 contiguous voxels, P < 0.005). (bottom right panel) Bar graphs show the magnitude of activations associated with the analytical vs experiential contrast in the low brooding (LB) and high brooding (HB) groups, based on a RRSb score median-split.

