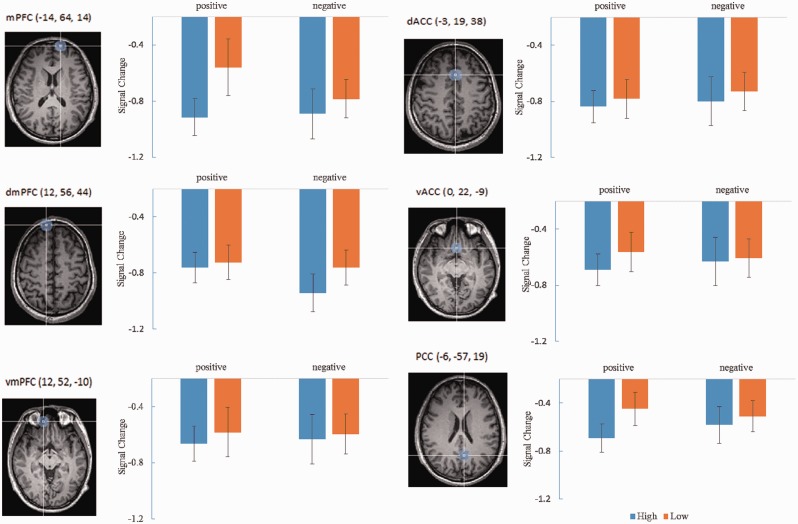
Fig. 2.
Axial sections display mPFC (left top), dmPFC (left middle), vmPFC (left bottom), dACC (right top), vACC (right middle) and PCC (right bottom) spherical ROIs superimposed on a normalized anatomic image. Graphs to the right of each image display signal change (parameter estimates) across each condition. Error bars indicate standard error of the mean.

