Figure 2.
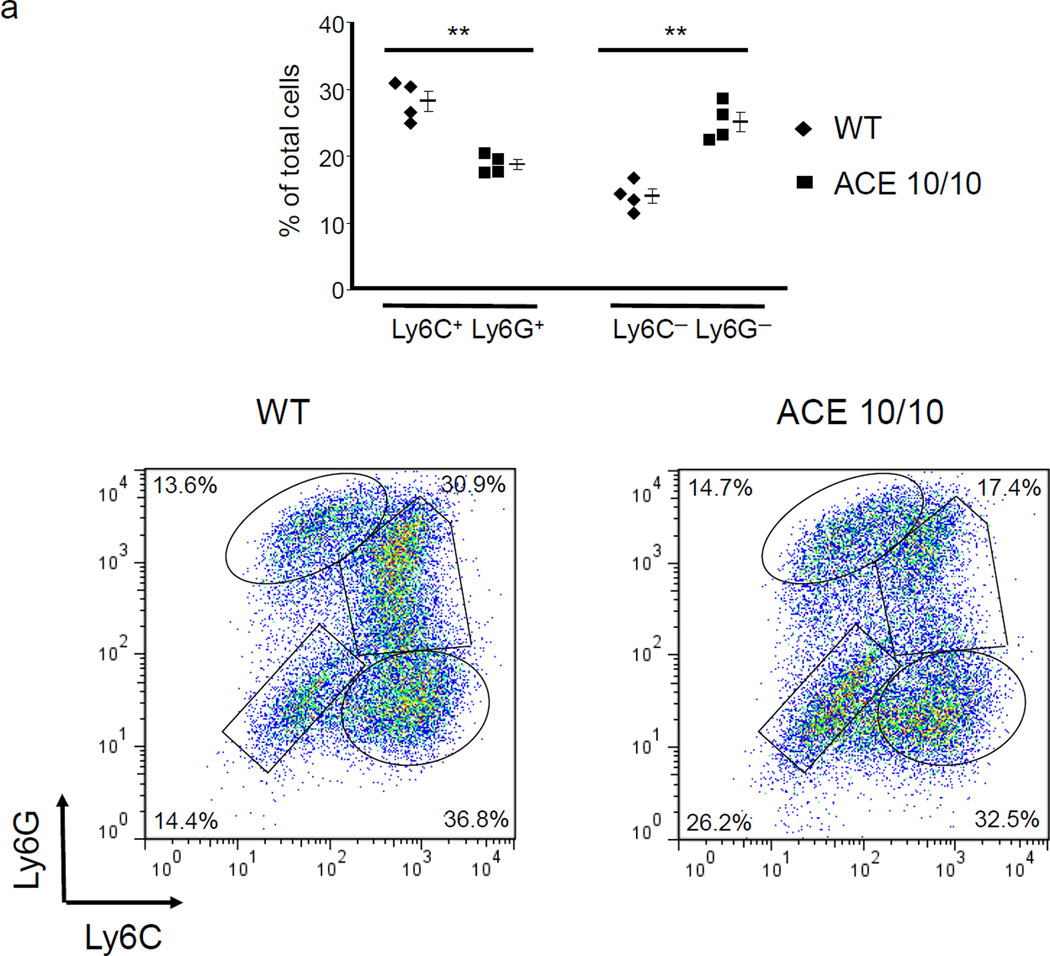
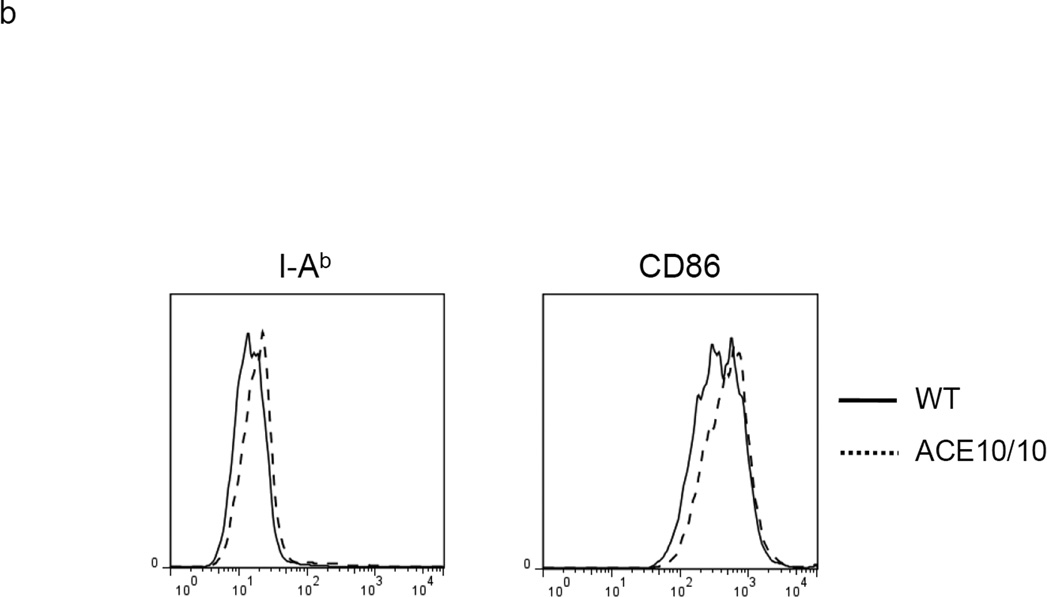
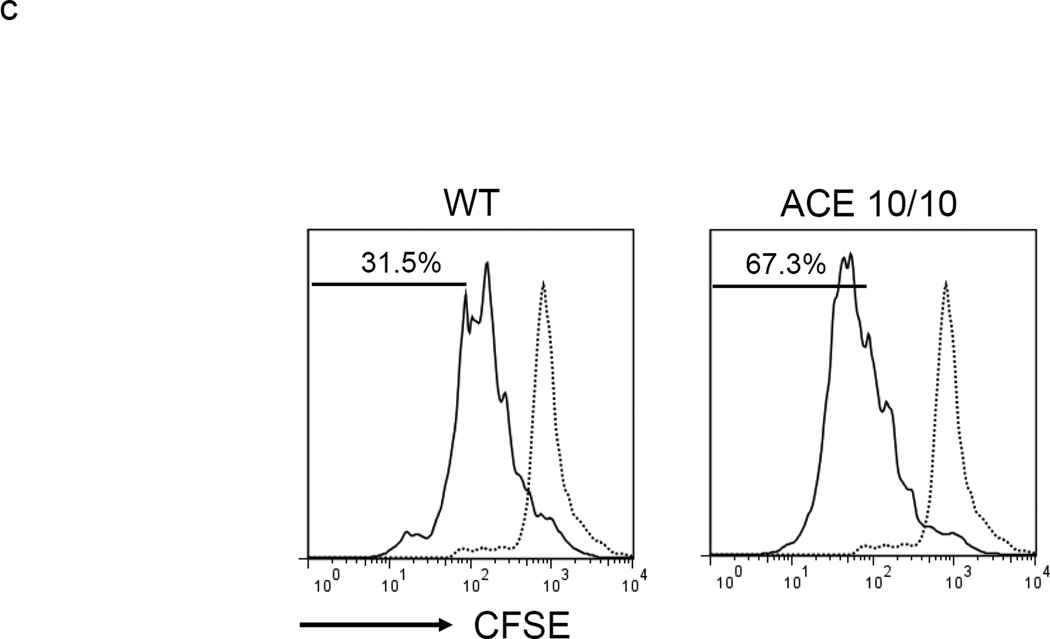
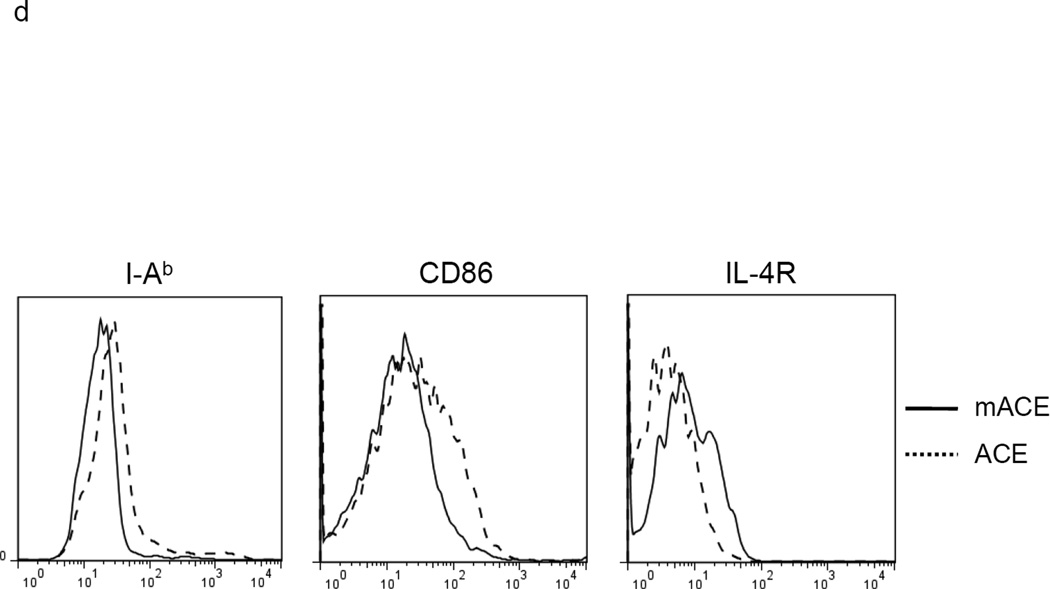
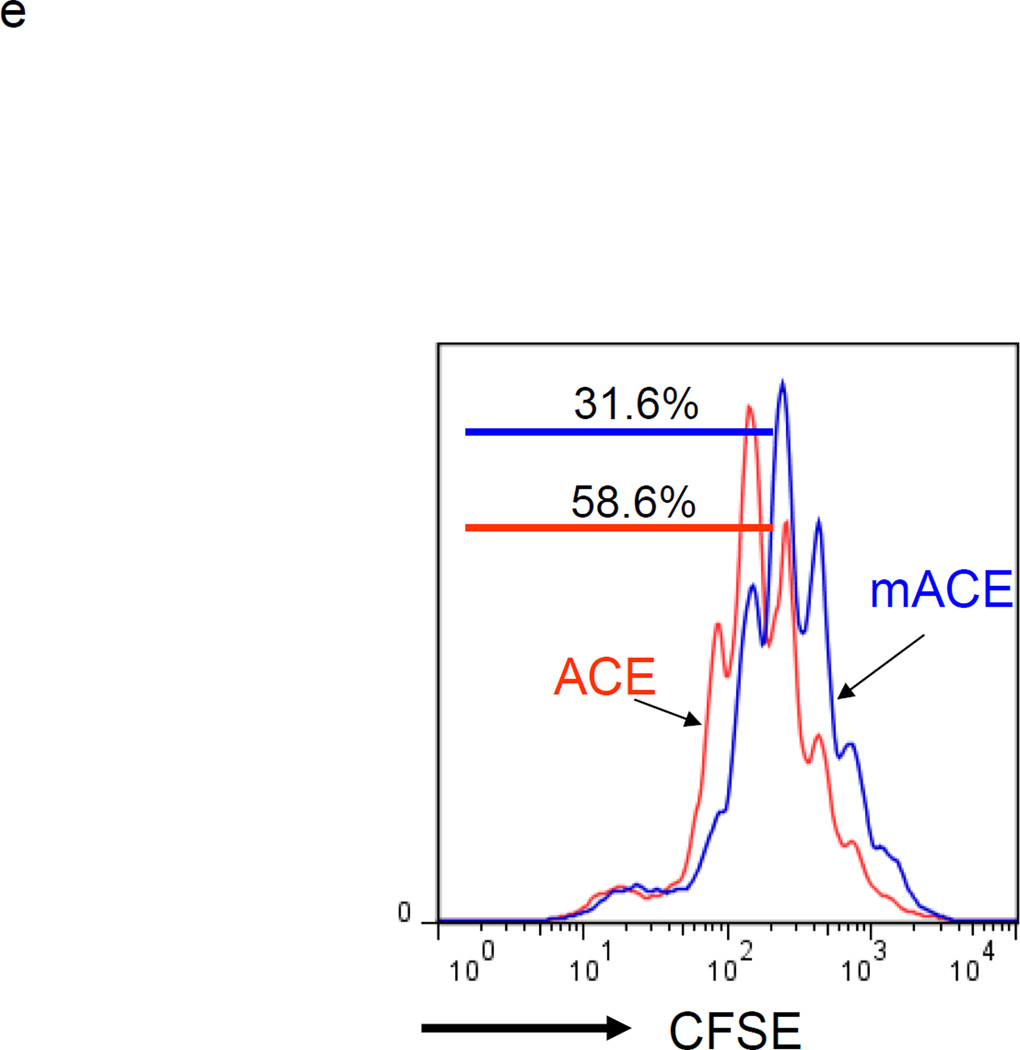
ACE over-expression induces myeloid maturation. a. The top portion of this panel shows the number of Ly6C+Ly6G+ and Ly6C−Ly6G− cells present in the cultured BM from WT and ACE 10/10 mice. ** P<0.01. The bottom portion of this panel is a typical flow cytometric analysis of the WT and ACE 10/10 cells. b. The expression levels of MHC class II and CD86 were measured on the surface of WT and ACE 10/10 BM-derived Ly6C+Ly6G+ cells. c. The non-adherent cells derived from WT and ACE 10/10 BM were co-incubated with stimulated CFSE-labeled T cells. Cytometric analysis after 3 days shows less suppression of T cell proliferation in those cells co-cultured with the ACE 10/10 cells. d. WT BM was transfected with vectors expressing either ACE or a catalytic domain mutated ACE (mACE). The surface expression of MHC class II, CD86 and IL-4Rα was measured after a 4 day culture. e. The non-adherent cells collected from ACE or mACE transfected BM cells were co-cultured with stimulated CFSE-labeled T cells. The T cell proliferation profiles are presented and show less suppression of T cell proliferation by those cells transfected with the catalytically active ACE construct. For all the experiments, the representative flow cytometry figures are typical of at least 3 independent experiments.

