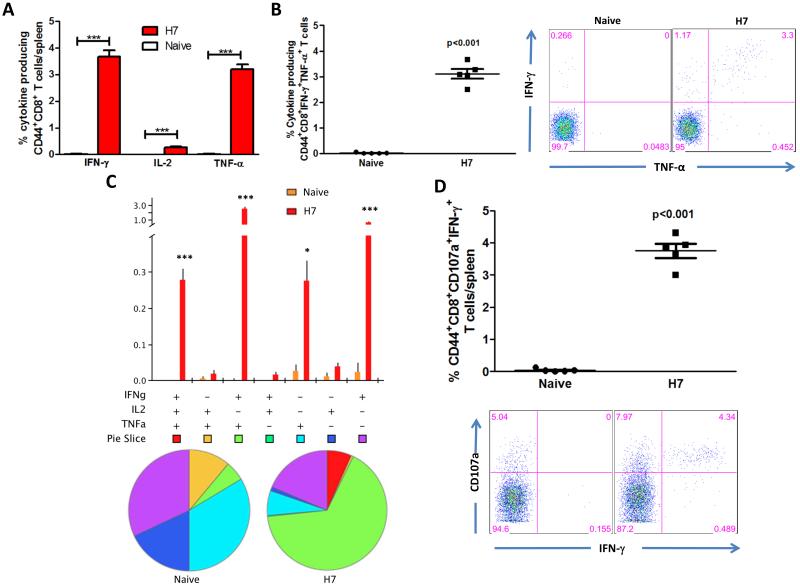
Figure 5.
Cytokine frequencies and phenotypic profiles of specific CD8 T cells after pH7HA immunization. Cytokine recall responses to H7 HA were measured 4 weeks after last immunization by ICS and flow cytometry. CD8 T cells were identified by CD3 expression and further gated as CD44+. (A) The percentage of total CD44+CD8 T cells expressing IFN-γ in response to H7 HA stimulation. (B) Average percentage of HA-specific CD44+CD8 double-positive-producing cells. (C) Multiparameter flow cytometry was used to determine the percentages of multifunctional CD8 T cell cytokine profile of H7HA. The bar chart shows the percentage of specific CD44+CD8 T cells displayed as triple, double, or single positive CD8 T cells. Pie charts show the relative proportion of each cytokine subpopulation to H7 HA stimulation. (D) Antigen-specific cytolytic degranulation T cells were measured by degranulation marker expression, CD107a and IFN-γ. Background staining from cells stimulated with medium alone has been subtracted. Data represent the mean±SEM of five mice per group with ***P < 0.001, **P < 0.01, *P < 0.05 using Student’s t-test.

