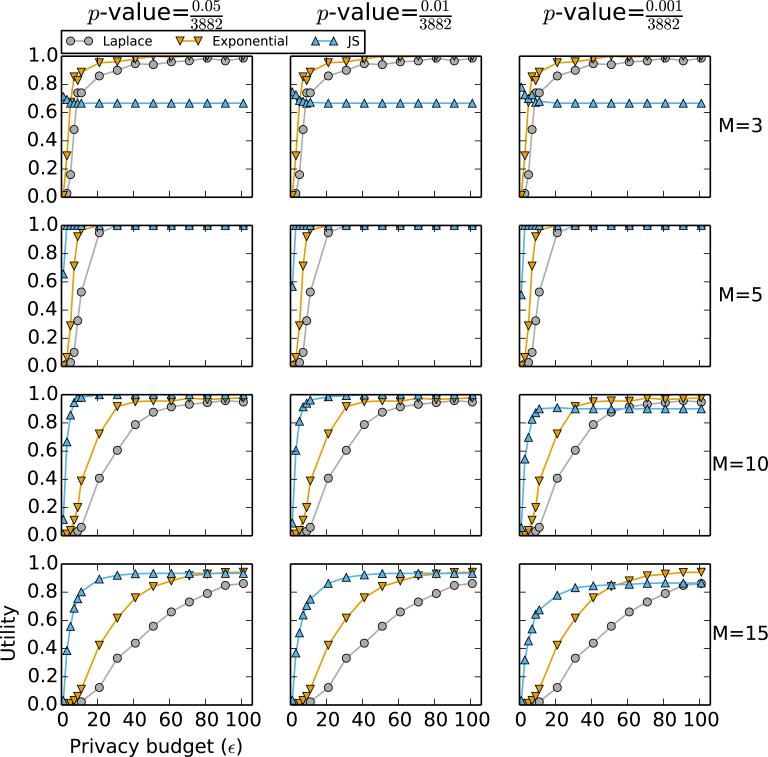
Figure 2.
Performance comparison of Algorithm 1 (“Laplace”), Algorithm 2 with χ2-statistics as scores (“Exponential”), and the LocSig method in Johnson and Shmatikov [3] (“JS”) based on the p-value of the χ2-statistic. Each row corresponds to a fixed M, the number of top SNPs to release. Each column corresponds to a fixed threshold p-value, which is relevant to the LocSig method only; it is irrelevant to the other methods. Data used to generate this figure consist of SNPs with p-values smaller than 10−5 and a randomly chosen 1% sample of SNPs with p-values larger than 10−5; the total number of SNPs used for calculation is 3882.

