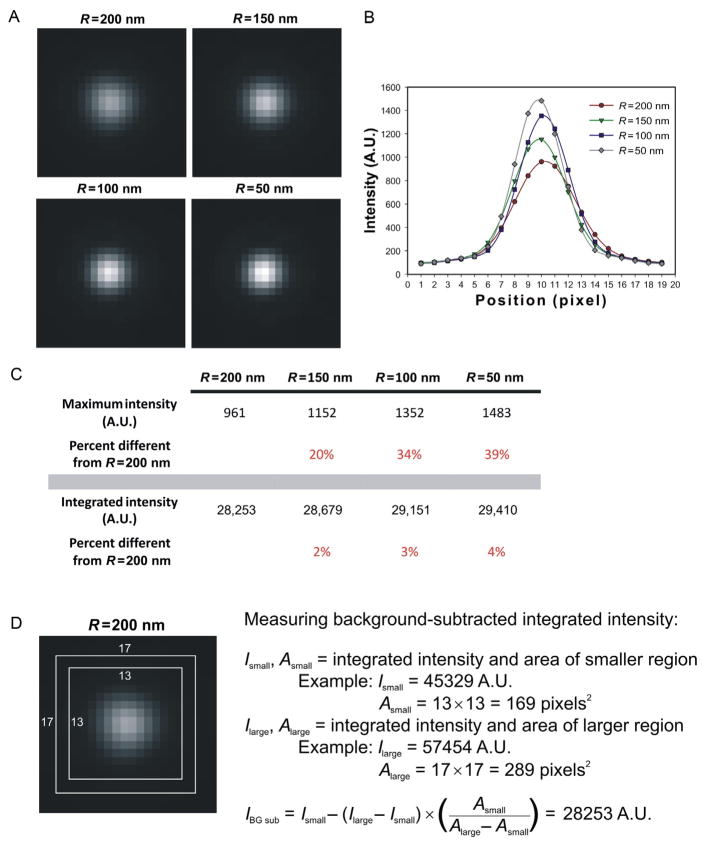
FIGURE 19.1.
Methods for measuring fluorescence intensity. (A) Simulated and convolved spheres of known subresolution diameters populated with a constant number of fluorophores (N=50) shown on the same intensity scale (generated using FluoroSim; Quammen et al., 2008). (B) Linescans through the brightest pixel of the simulated sphere images. The maximum intensity decreases as the size of the sphere is increased. (C) Comparison of maximum intensity and integrated intensity measurements. Integrated intensity values show a 4% difference between values measured for the largest and smallest spheres. For comparison, the maximum intensity values show an almost 40% difference. (D) The procedure for measuring background=corrected integrated intensity. Briefly, two square regions are drawn around the signal of interest and the integrated intensity values of these are recorded. Using the areas and integrated intensities of these squares, the final background=corrected integrated intensity can be calculated (Example shown is for the R=200 nm simulated sphere image from (A).).

