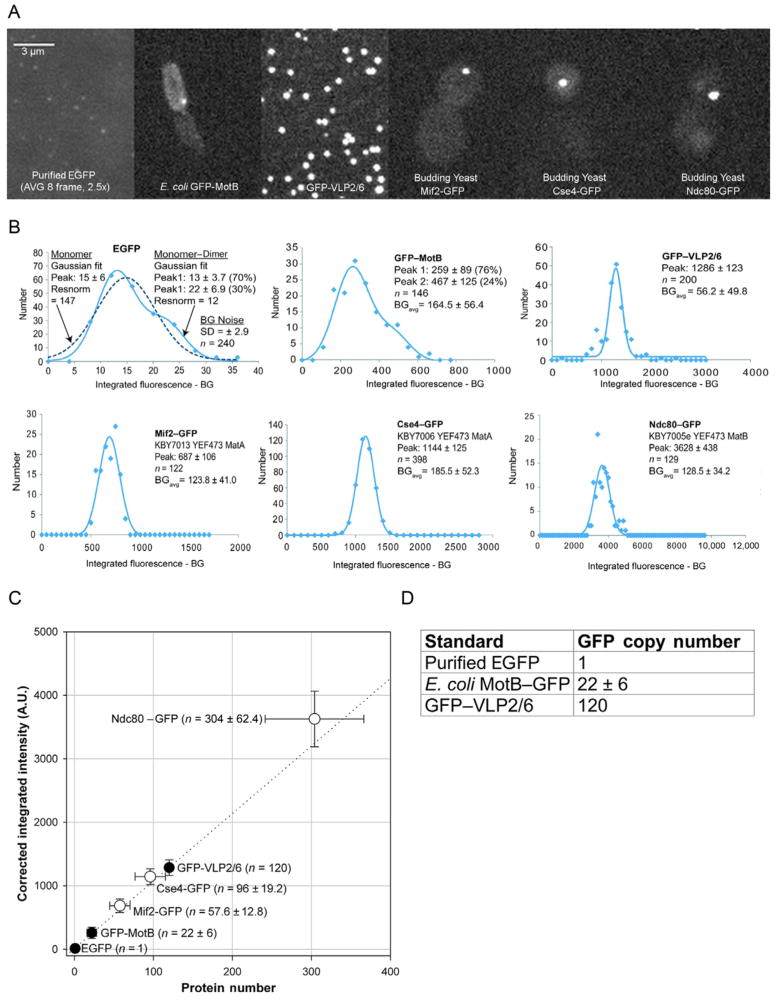
FIGURE 19.2.
Generating a standard curve. (A) Representative images of standards used in Lawrimore, Bloom, and Salmon (2011) and yeast strains in which anaphase copy numbers were measured. Purified EGFP (top left panel) was imaged with 2.5=fold longer exposure time (1500 vs. 600 ms) than other specimens and image shown is an average of eight images. (B) Gaussian fits of depth= and photobleaching=corrected integrated fluorescence intensity for standards and anaphase GFP spots in yeast strains. Peak intensities of each Gaussian fit are provided with standard deviation. EGFP and GFP–MotB can be fitted with two Gaussian curves (peak 1 and peak 2). BG noise is the average background intensity corrected for in each sample. (C) Standard curve generated from EGFP=, GFP–MotB=, and GFP–VLP2/6=corrected integrated fluorescence intensity versus protein number (black circles) with GFP spots from yeast strains (white circles). The dotted line represents a linear regression of the three standards (black circles). Values±standard deviation. (D) Table of GFP copy numbers for three fluorescence standards used to generate the standard curve in (C).

