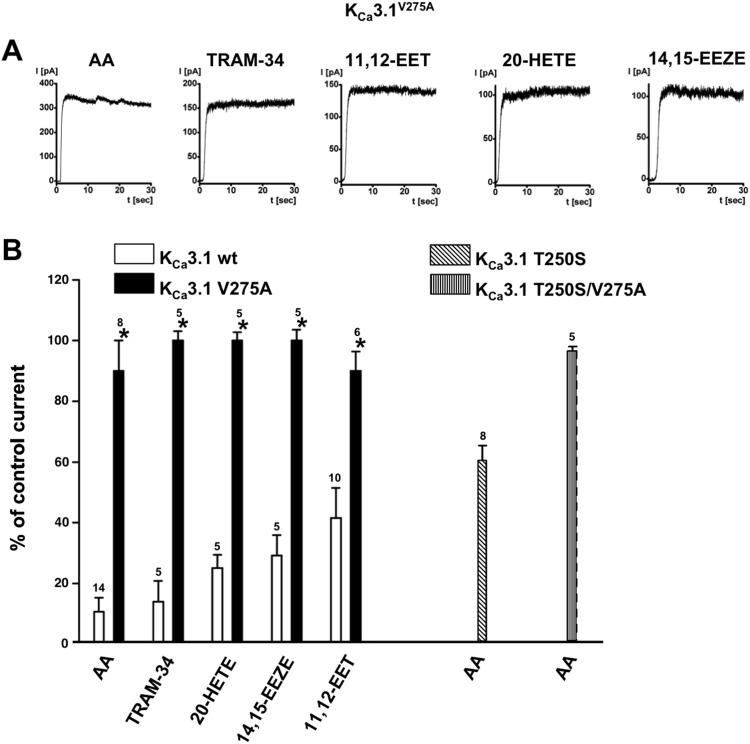
Figure 4. Insensitivity of hKCa3.1 mutants.
A) Representative current traces obtained from inside-out recordings using HEK-293 expressing the hKCa3.1V275A mutant. B) Summary data from experiments using the three different hKCa3.1 mutants and wt hKCa3.1. Concentration of all compounds was 10 µM. Data are means ± SEM; numbers in the graphs indicate the number of inside-out experiments. *P<0.05 vs. wt; One-way ANOVA and Tukey post hoc test.

