
Figure II.
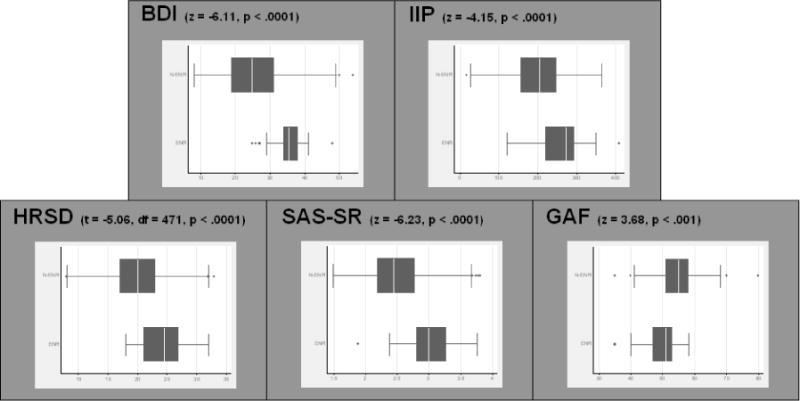
Box plots of pre-treatment symptom measures, separated by end-of-treatment ENR status. Pre-treatment GAF, BDI, HRSD, IIP, and SAS-SR scores differed significantly between the ENR and non-ENR groups, in keeping with the findings of the Seattle study. Note: continuous HRSD scores depicted. For binary HRSD: Fisher’s exact, p<.001.