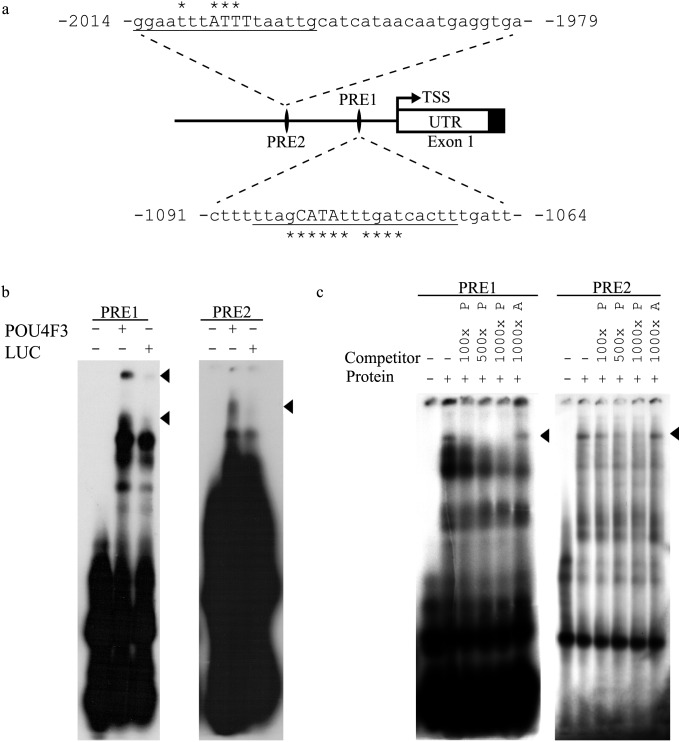
Figure 1. Identification and verification of POU4F3 recognition elements in the Nr2f2 5′ flanking region.
a. Schematic diagram of the location of two putative POU4F3 recognition elements (PREs) identified in the Nr2f2 5′ flanking region and used in EMSA analysis. Underlined bases correspond to POU4F3 binding sites predicted by MatInspector software with capital letters denoting matches to the core sequence. The asterisks signify matrix position conservation >60/100 (TSS, transcriptional start site and UTR, un-translated region). b. Sequences shown in a were used as radiolabelled probes in EMSA analysis with in vitro translated POU4F3 or a Luciferase control. Bandshifts due to protein-specific binding by POU4F3 are indicated by arrowheads. c. The same probes were used in EMSA analysis with UB/OC-2 cell nuclear protein extract. Reactions were incubated either alone, with UB/OC-2 cell nuclear protein extract or with the nuclear protein extract and an excess of non-radiolabelled competitor oligonucleotide as indicated. The ‘P’ suffix refers to non-radiolabelled POU4F3 binding sequence whereas the ‘A’ suffix indicates a non-radiolabelled AP4 binding sequence. POU4F3-sequence-specific shifts are indicated by arrowheads.

