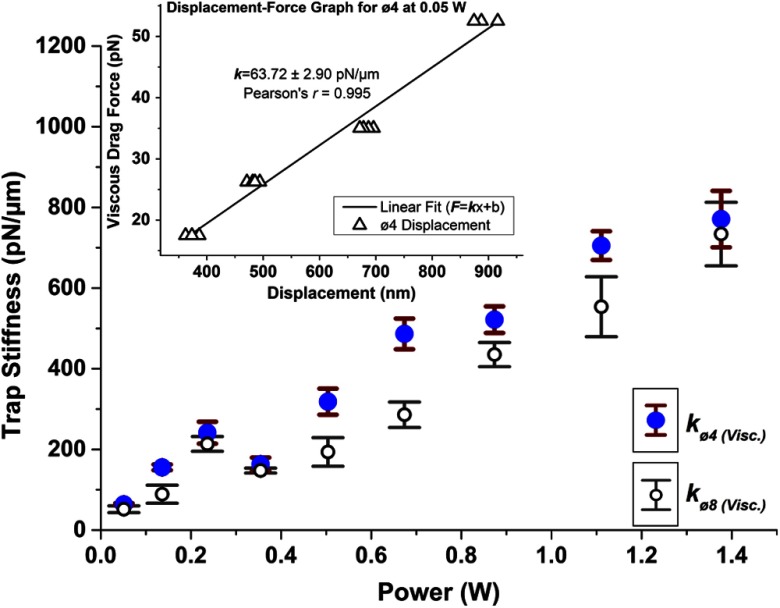
Fig. 2.
Trap stiffness as a function of laser power at the specimen plane, using the active calibration method based on application of viscous drag force. The data points (represented as larger filled circles) and data points (represented as smaller unfilled circles) correspond to the estimated stiffness values of red and green fluorescent beads, respectively. The inset shows a typical displacement-force graph for the red beads at 0.05 W. The data points (shown as unfilled triangles) represent bead displacements from the center of the trap resulting from calculated viscous drag forces. The error bars to the mean estimated stiffness values using the red and green fluorescent beads are represented by thick vertical lines with short horizontal caps and thin vertical lines with long horizontal caps, respectively.

