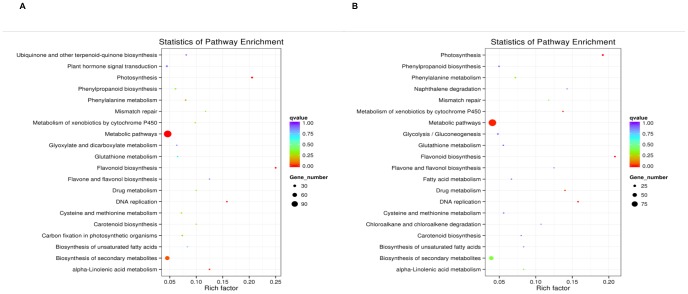
Figure 2. KEGG analysis results of DE genes at the SS and MS stages comparing JA-CMS and JB lines.
Rich factor is the ratio between counts of DE genes and all annotated genes enriched in a certain pathway; qvalue is P value after multiple hypothesis testing correction with a range between 0 and 1. Twenty most significant pathways were plotted, when more than 20 pathways were identified. A) Results for the SS stage. B) Results for the MS stage.

