
Fig. 4.
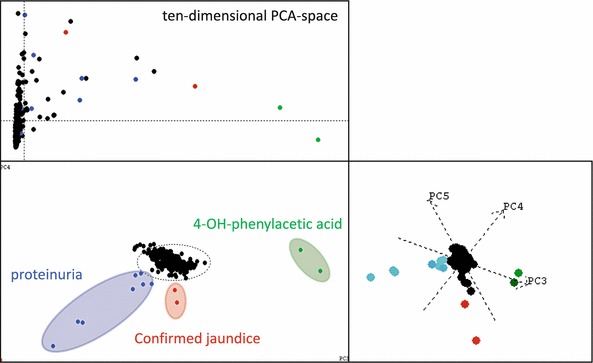
Use of principal component analysis to detect outliers, e.g. proteinuria and confirmed jaundice, as well as 4-OH-phenylacetic acid. The upper left subplot represents the influence plot derived from a 10-dimensional subspace. The lower left plot is the scores plot in principal components 1 and 2. The right plot is the scores plot in PC 3, 4, and 5. Color coding shows the relations of the outlying samples in PC 1, 2 and PC 3, 4, 5. That means, the outlying samples color coded in the figure are outlier in at least a five-dimensional PCA subspace. Proteinuria (blue color) and jaundice (red color) were confirmed in the clinical records of the respective newborns. The figure illustrates, how some of the atypical samples can be easily detected even with a most simple straight forward PCA