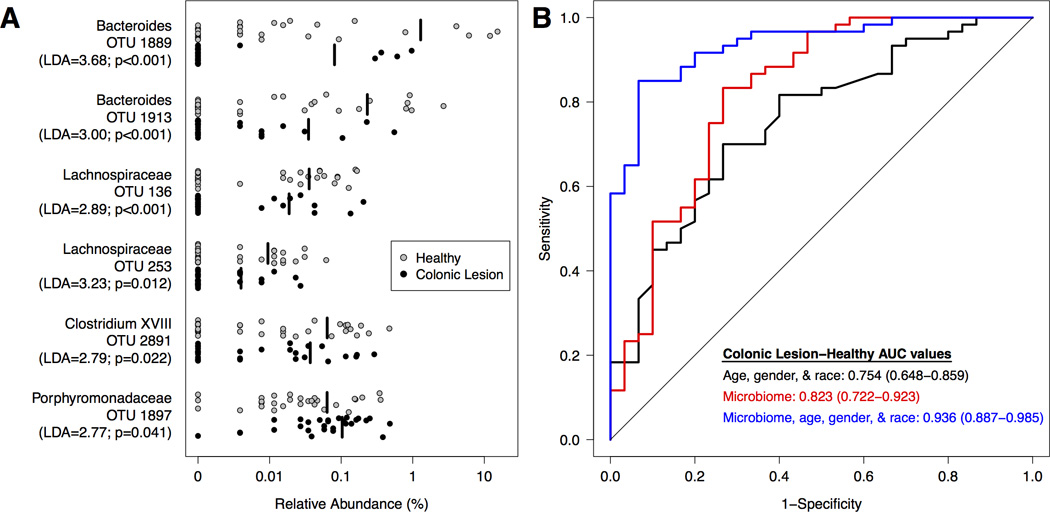
Figure 3. Microbial biomarkers improve accuracy of predictive models for differentiating between healthy subjects and those with colonic lesions.

Adenoma and carcinoma subjects were combined into a single clinical group (Lesions; n=60). A. Relative abundance of differentially abundant OTUs for healthy (n=30; grey) subjects and those with lesions (n=60; black). The mean relative abundance is represented for each clinical group by a vertical black line. B. ROC curves for microbial biomarkers alone, clinical data alone, and microbial biomarkers with clinical data. The straight line represents the null model.
