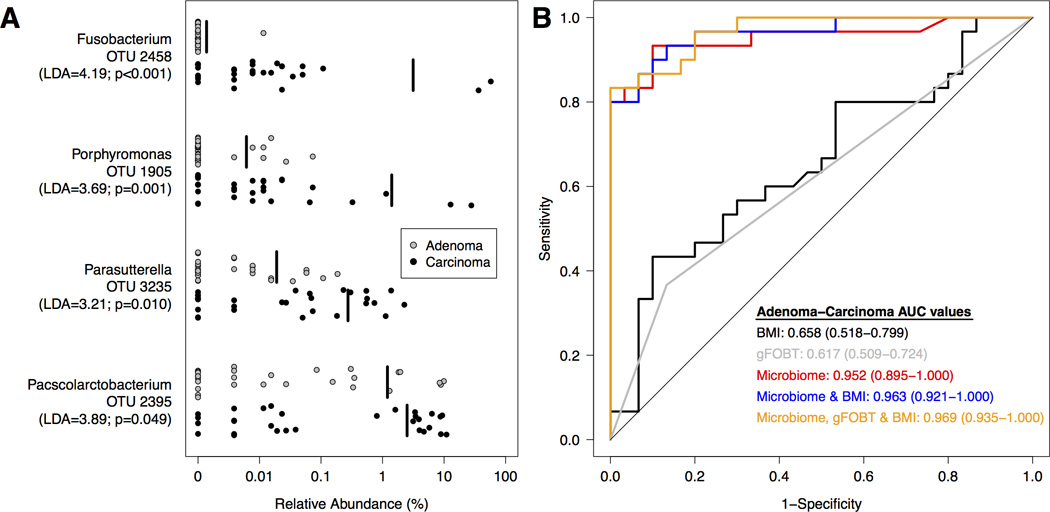
Figure 4. Microbial biomarkers improve accuracy of predictive models for adenoma and carcinoma clinical groups.

A. Relative abundance of differentially abundant OTUs for adenoma (n=30; grey) and carcinoma (n=30; black) subjects. The mean relative abundance is represented for each clinical group by a vertical black line. B. ROC curves for microbial biomarkers alone, clinical data alone, FOBT alone, microbial biomarkers with clinical data, and microbial biomarkers with FOBT and clinical data. For each comparison, the straight line represents the null model.
