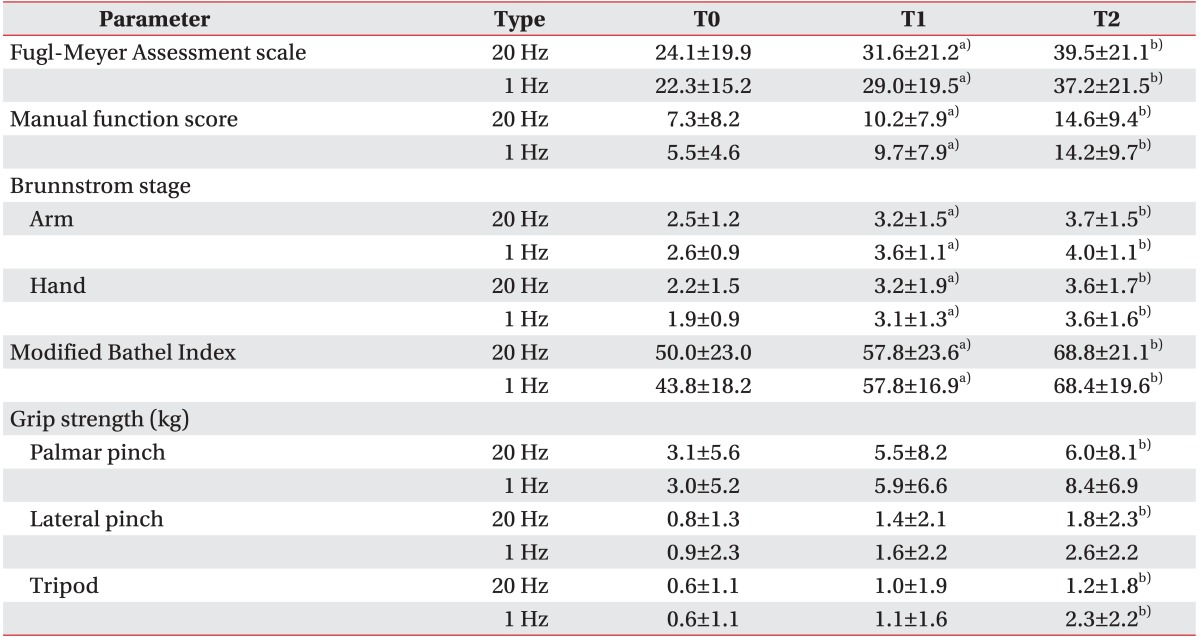
Table 2.
Change of Fugl-Meyer Assessment scale, manual function test, Brunnstrom stage, Modified Bathel Index, and grip strength for both groups

Values are presented as mean±standard deviation.
rTMS, repetitive transcranial magnetic stimulation; T0, before rTMS; T1, immediately after the session of rTMS; T2, one month after the end of the last rTMS session.
a)p<0.05, comparison of before rTMS versus immediately after the end of rTMS.
b)p<0.05, comparison of before rTMS versus one month after the end of rTMS.
