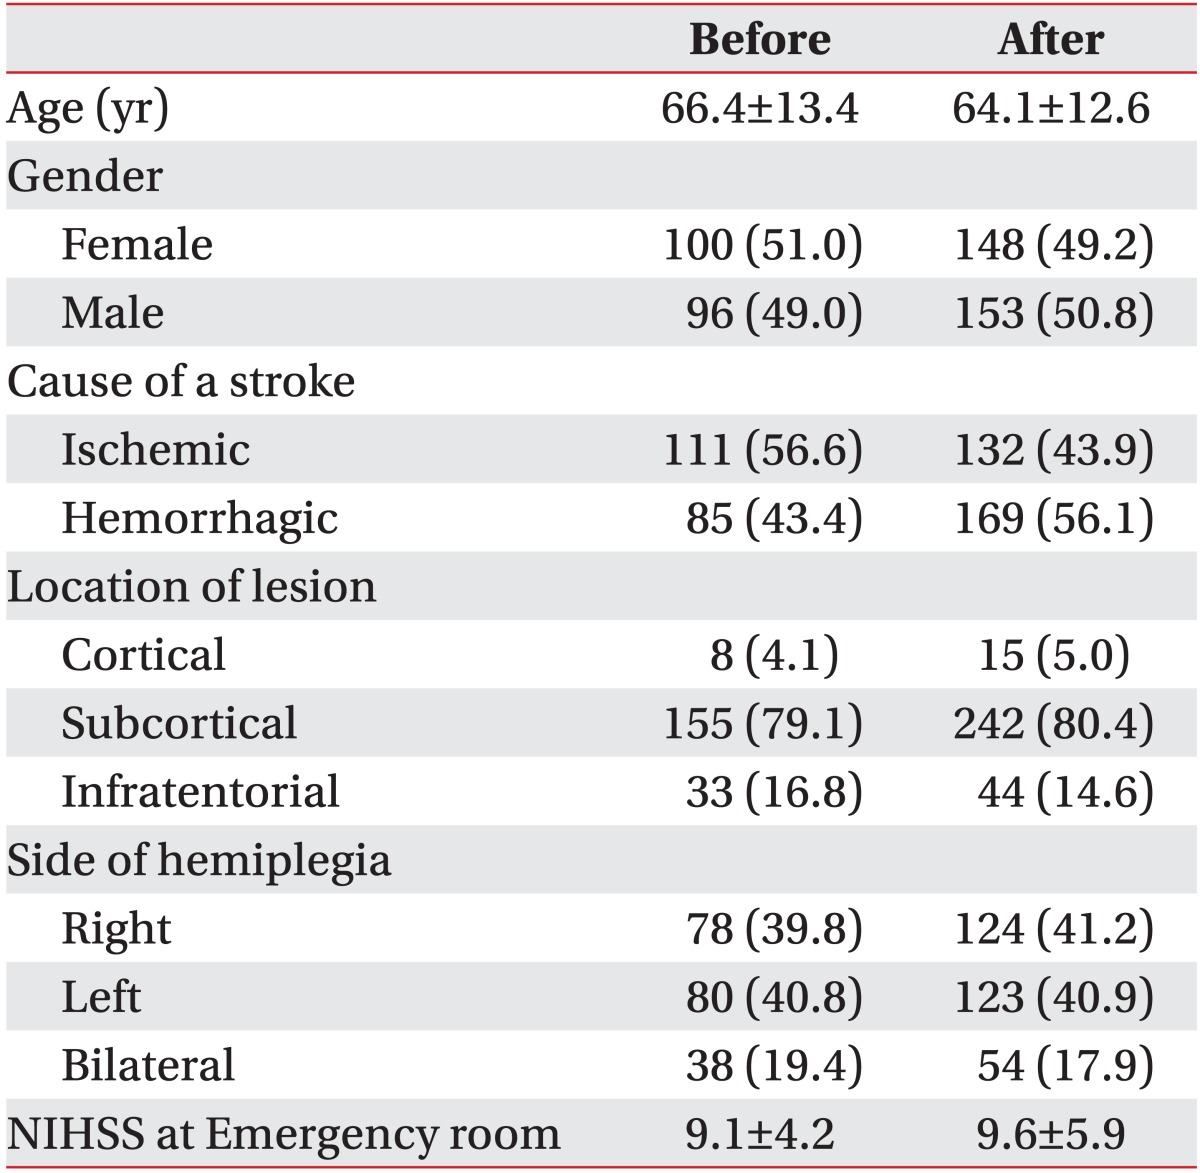
Table 1.
Comparison of demographic and stroke characteristics before and after CP implementation

Values are presented as mean±standard deviation or number (%).
CP, critical pathway; NIHSS, National Institutes of Health Stroke Scale.
Comparison of demographic and stroke characteristics before and after CP implementation

Values are presented as mean±standard deviation or number (%).
CP, critical pathway; NIHSS, National Institutes of Health Stroke Scale.