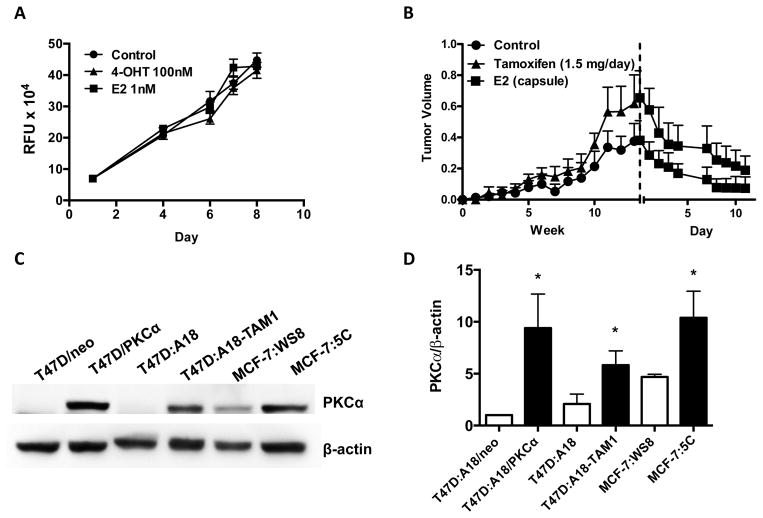
Figure 1. PKCα-overexpression in breast cancer cells correlates with sensitivity to E2-induced growth inhibition.
A) Effect of E2 and 4-OHT on T47D:A18-TAM1 proliferation in vitro. DNA assays were performed as described in Materials and Methods. Graph shows mean ± SEM and is representative of three independent experiments. B) Effect of TAM and E2 on T47D:A18-TAM1 xenograft growth. 2 mice/group were bilaterally injected with T47D:A18-TAM1 cells and either left untreated or were given oral TAM (1.5 mg/day). Dashed line represents the start of E2 treatment. C) Western blot analysis of PKCα expression in E2-stimulated (T47D:A18/neo, T47D:A18, MCF-7:WS8) and E2-inhibited (T47D:A18/PKCα, T47D:A18-TAM1, and MCF-7:5C) cell lines. D) Densitometric quantification of three western blots from three independent cell lysates. Student’s t-test was used to compare each E2-inhibited cell line to the E2-stimulated counterpart. *, P ≤ 0.05.

