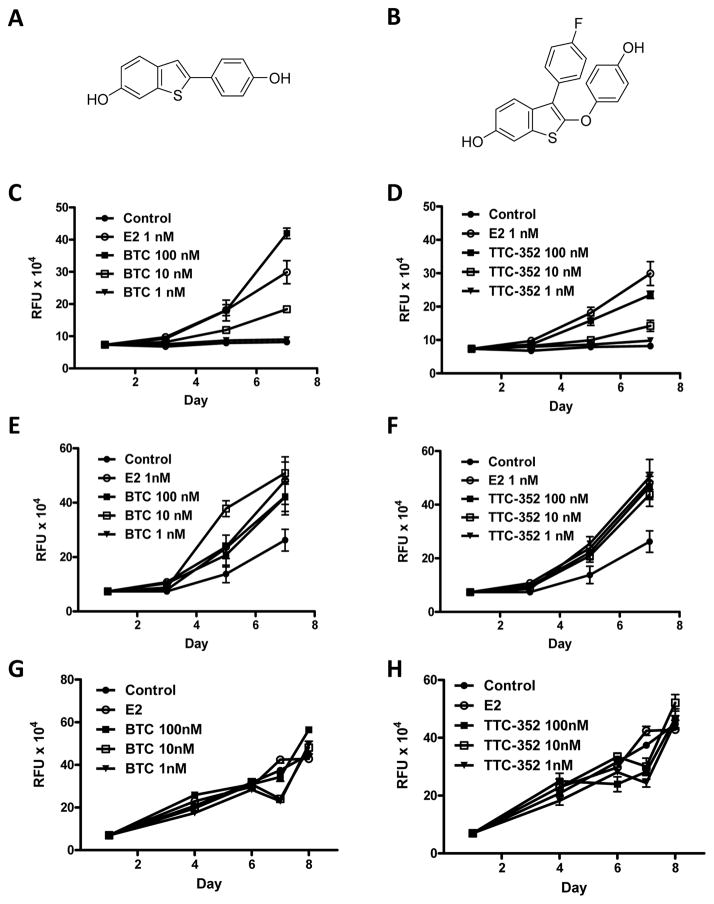
Figure 2. Effect of BTC and TTC-352 on proliferation of T47D:A18/neo and T47D:A18/PKCα cells in vitro.
Structures of BTC (A) and TTC-352 (B). Effect of BTC and TTC-352 treatment on the growth T47D:A18/neo cells (C and D respectively), T47D:A18/PKCα cells (E and F respectively) and T47D:A18-TAM1 cells (G and H respectively). DNA assays were performed as described in Materials and Methods. Graphs show mean ± SEM and are representative of three independent experiments.

