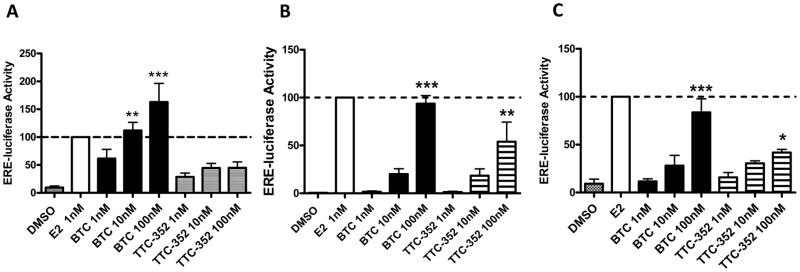
Figure 4. BTC and TTC-352 induce ERα transcriptional activity in T47D:A18/neo, T47D:A18/PKCα and T47D:A18-TAM1 cell lines.

A) T47D:A18/neo, B) T47D:A18/PKCα and C) T47D:A18-TAM1 cell lines. Data is expressed normalized to E2 (100%).*, P ≤ 0.05 versus DMSO. **, P ≤ 0.01 versus DMSO. ***, P ≤ 0.001 versus DMSO. Graph shows mean ± SEM of 3 independent experiments.
