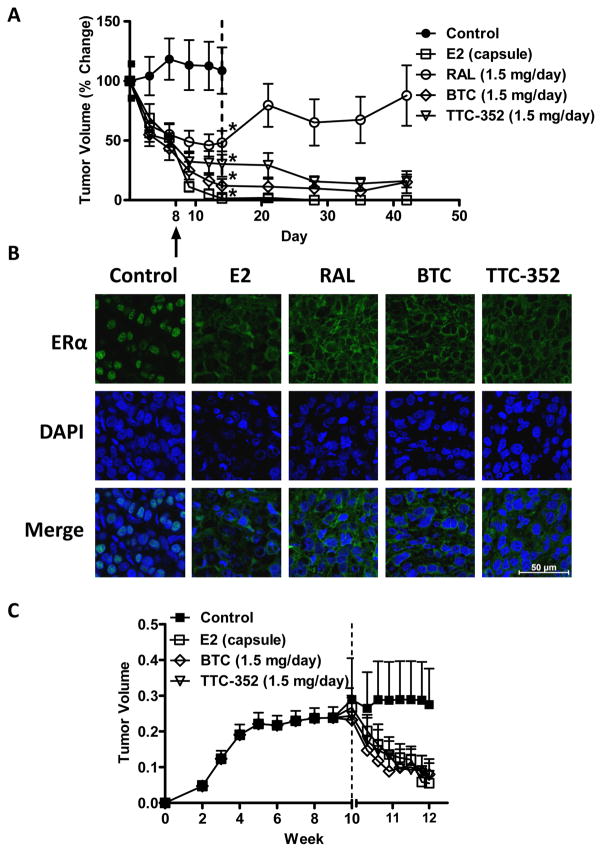
Figure 5. BTC and TTC-352 inhibit T47D:A18/PKCα and T47D:A18-TAM1 xenograft tumors.
A) BTC and TTC-352 treatment result in regression of T47D:A18/PKCα tumors. Graph shows percentage of tumor regression (100% ~0.5 cm2). Dotted line indicates when treatment was ended. Arrow designates where tumors from (B) were obtained. *, P ≤ 0.001 versus control. Graph shows mean ± SEM. B) ERα localization in T47D:A18/PKCα tumors by immunofluorescence staining. Total magnification: 630X.C) T47D:A18-TAM1 tumors regress when treated with BTC and TTC-352. Dotted lines represents start of treatment.

