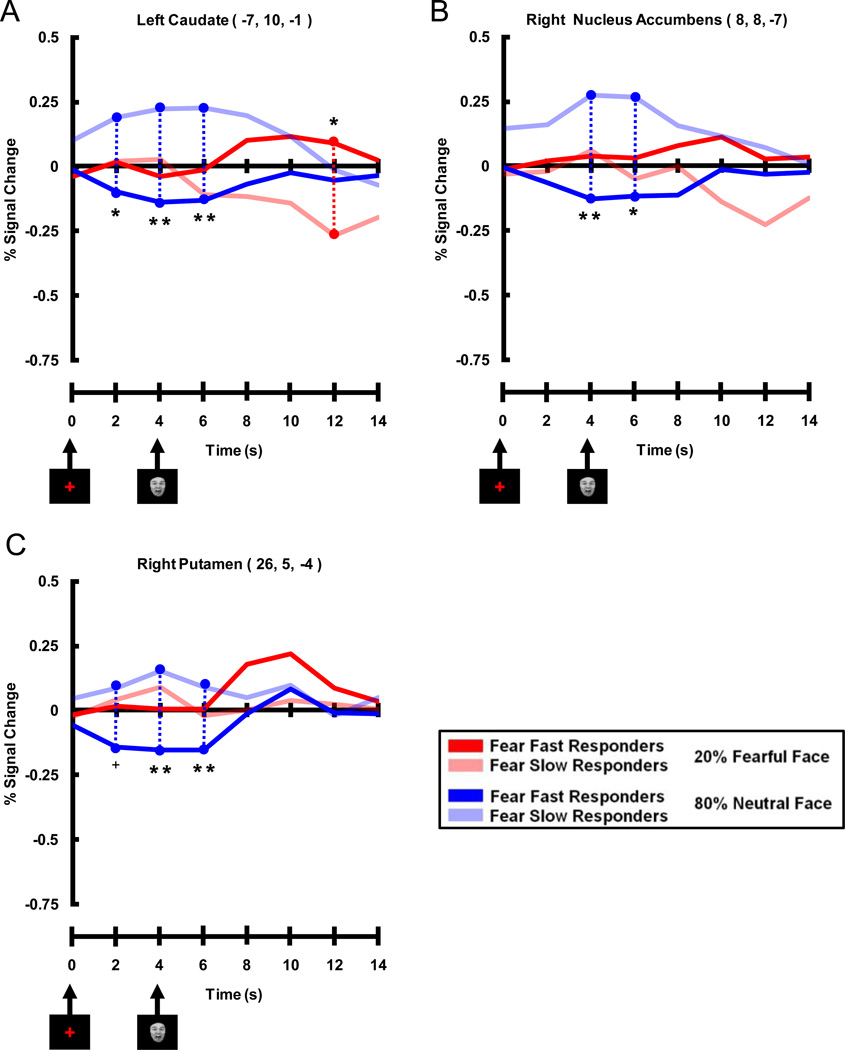
Figure 7. Timecourses Extracted from Peak Voxels Displaying Early Negative Correlation Between Percent Signal Change for Expected Neutral Faces and Valence Bias Scores.
Areas of the dorsal and ventral striatum of the basal ganglia included A) left caudate, B) right nucleus accumbens, and C) right putamen. These time courses illustrate that Fear Slow Responders (light blue lines) had more activation than Fear Fast Responders (dark blue lines) early (i.e. 2, 4 and 6 s post-cue, 0 and 2 s post-face) in expected neutral face trials. It is interesting to note that although these peak voxels were significant for the negative correlation between Valence Bias scores and percent signal change for expected neutral faces, the left caudate (A) also displayed a late (i.e. 12 s post-cue) trial enhancement for Fear Fast Responders (dark red lines) compared to Fear Slow Responders (light red lines) for unexpected fearful faces. (** = p < 0.01 corrected, * = p < 0.05 corrected, + = p < 0.10 corrected)

