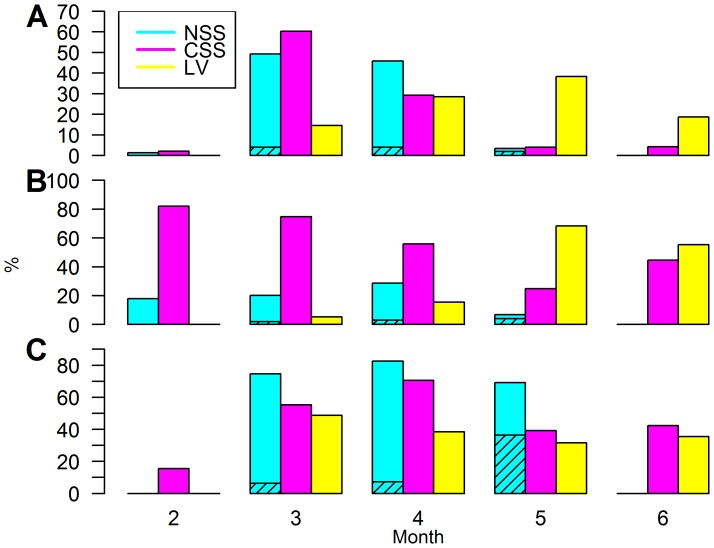
Figure 6. Seasonal change in proportion of different herring populations.
Proportion (%), standardized to one gillnet per sample and area, by month of Norwegian spring spawning (NSS), Coastal Skagerrak spring spawning (CSS) and Landvik (LV) herring relative to a) total number analyzed over entire study period (see Table 1 for N), b) total number at month and c) spawning and spent herring (stage of maturity> = 6) relative to total number at month (see Table 2 for N). Shaded areas are NSS herring inside Landvikvannet.

